Cables vs. malloc_trim, or yet another Ruby memory usage benchmark
Topics

Single line, big promise
Memory usage has always been one of the most discussed performance-related topics in the Ruby community.
Last week it got even more attention after Hongli Lai published his excellent “What causes Ruby memory bloat?” post.
The author has proposed a very simple patch to Ruby’s (MRI, to be precise) garbage collector: to add a call to malloc_trim at the very end of the full GC cycle and release some allocated memory back to the kernel.
NOTE: To make the previous paragraph not sound all Greek to you, read the post by Hongli Lai—he did a really great job explaining complex things; I cannot do better, so I leave you with the link.
The day after the publication, Noah Gibbs did some RRB (Rails Ruby Benchmark) benchmarks and found that the performance improvement (requests timing) is just about %1. Nothing to write home about, right?
On the other hand, like Noah noticed, “1 line of changed code for a 1% speedup is hard to complain about”.
So, I decided to measure the impact of the patch on Action Cable that is somewhat infamous for its speed and memory usage (check out AnyCable for a speedier replacement).
I’ve been doing Action Cable benchmarks since 2016, when I started my work on AnyCable, so I already had a setup for that.
I usually do Action Cable benchmarks when some new things appear: either new web servers (e.g., see the benchmarks for Iodine and Falcon) or novel Ruby features (like the malloc_trim patch or the upcoming GC.compact) that I plan to try out next time.
The framework itself hasn’t changed a lot since its early days (yeah, Rails 6 will ship with Action Cable testing support, but it has nothing to do with performance). It’s mature and stable. And it still eats tons of memory.
NOTE: see the “High-speed Ruby cables” talk (or watch the slides) from the latest RubyConf to learn more about Action Cable’s (and other cables) scalability issues.
… and the benchmark
The benchmark is running slow
The benchmark is based on Hashrocket’s WebSocket shootout (more precisely, its broadcast part).
We measure the broadcasting round-trip time (RTT), i.e., how much time does it take for the server to re-transmit the message to all the connected clients—the less the time, the better the real-time-ness of the server.

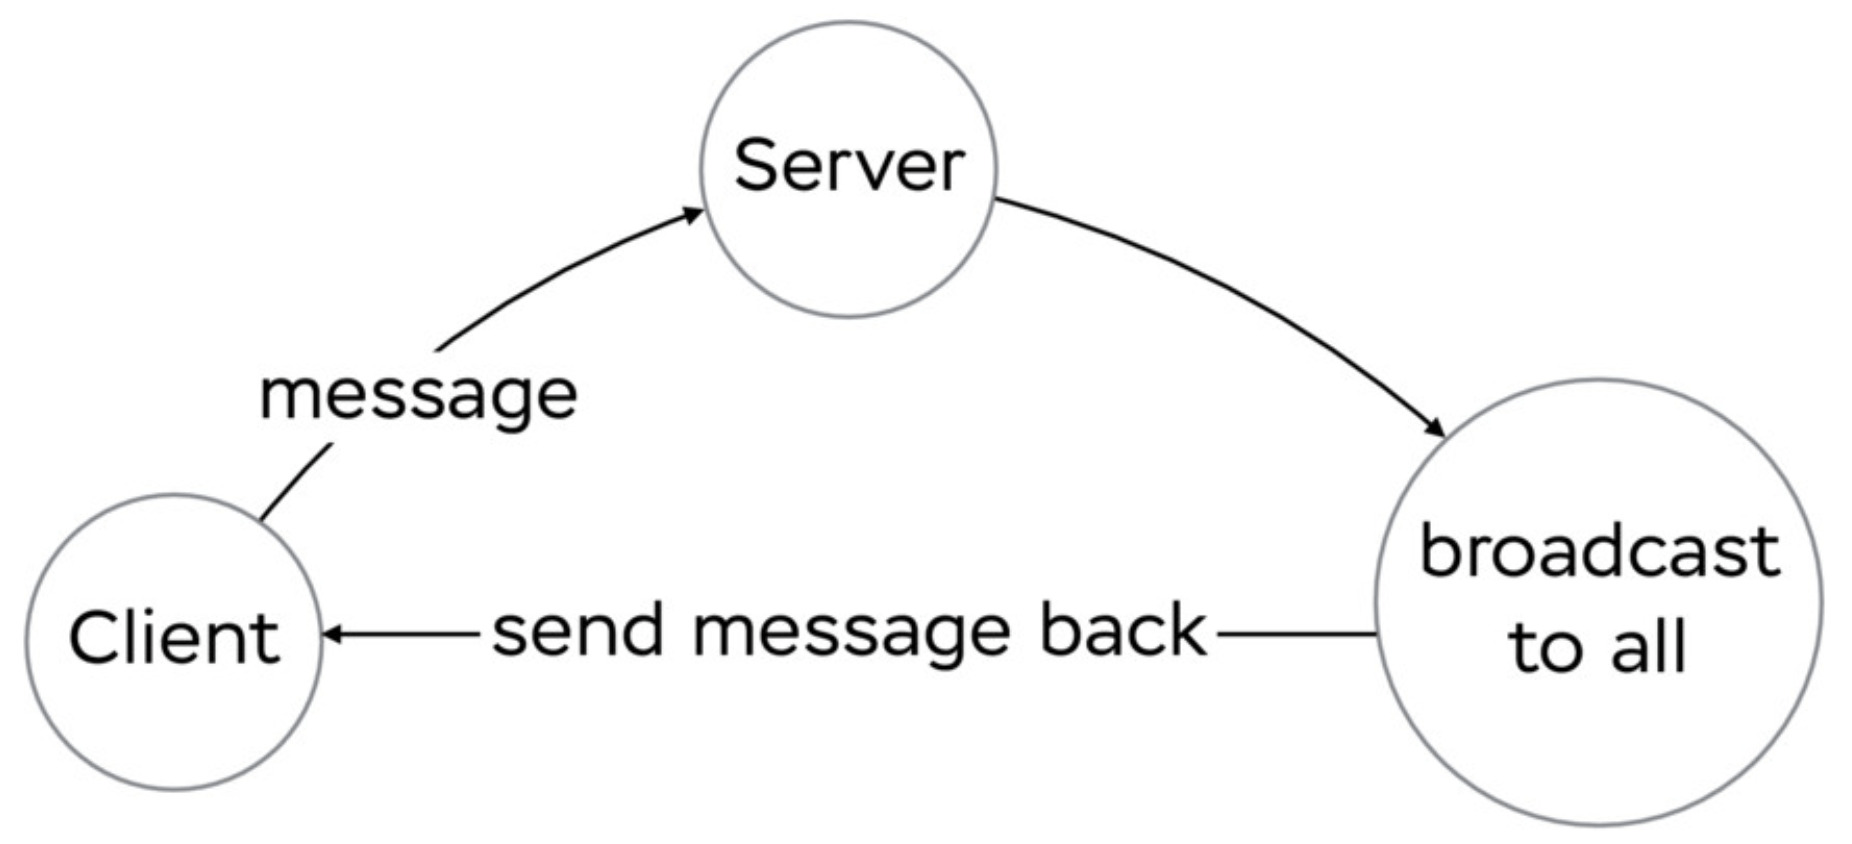
Broadcasting diagram
As a side-effect, we also capture the application memory usage during the benchmark using psrecord utility.
I’m using AWS EC2 c3.2xlarge (8 vCPU, 15 GiB RAM) instances for both server and benchmark client and running Puma with the default number of threads (0:16) and 8 workers.
The benchmark configuration:
- 10 steps by 1K connections (i.e., 10K connections in the end)
- at every step, 100 random clients initiate broadcasting (with 8X concurrency)
- the size of the message payload is 200B.
I compared three different configurations (all use Rails 6.0.0.beta3):
- Ruby 2.6.2 (baseline)
- Ruby 2.6.2 +
MALLOC_ARENA_MAX=2(one of the oldest spells to improve Ruby application memory usage) - Ruby 2.7-dev (
trunk) withmalloc_trimpatch.
Let’s talk about expectations a bit:
- we expect the memory usage to be lower with either
MALLOC_ARENA_MAX=2ormalloc_trimpatch - we also would like to see some positive changes in the performance (lower RTT).
🏁 Ready, Steady, Run!
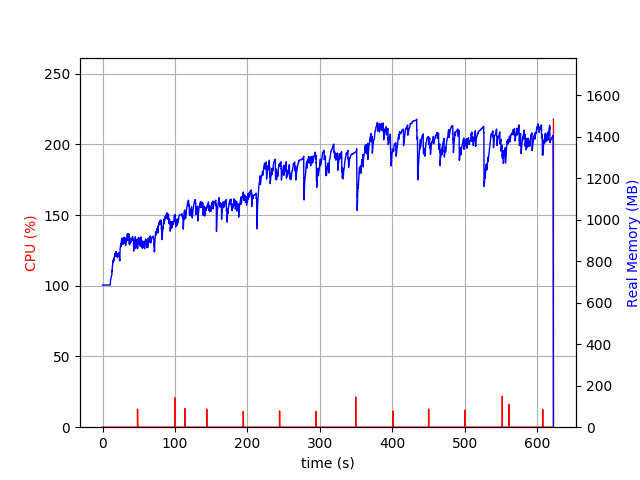
Here is the memory profile for the baseline:

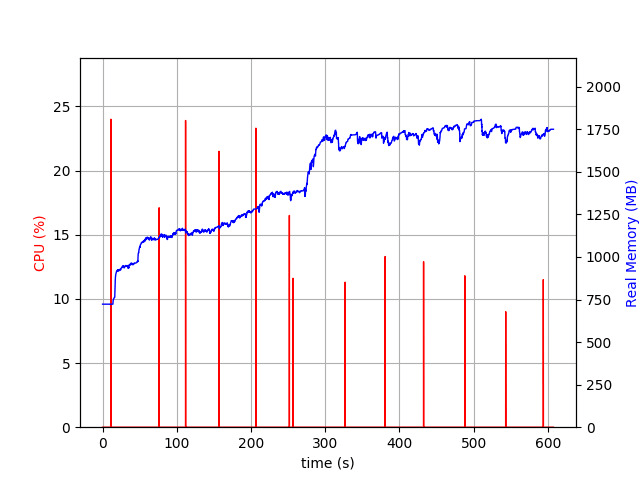
Memory (Ruby 2.6.2, default VM settings)
NOTE: ignore red lines (should be CPU), it doesn’t seem accurate when running multiple child processes (and I don’t know how to turn it off 🙂).
We have ~1.8GB of memory at the end (i.e., after connecting 10K clients and sending 1K messages).
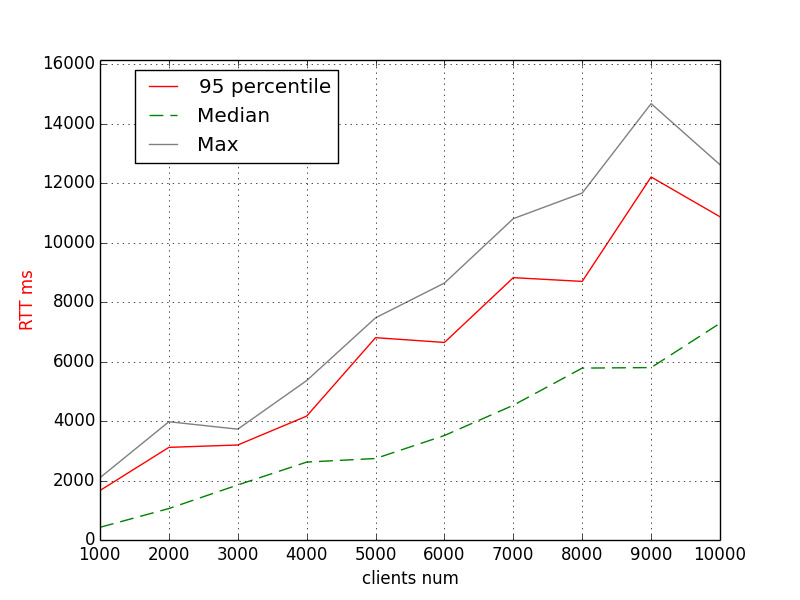
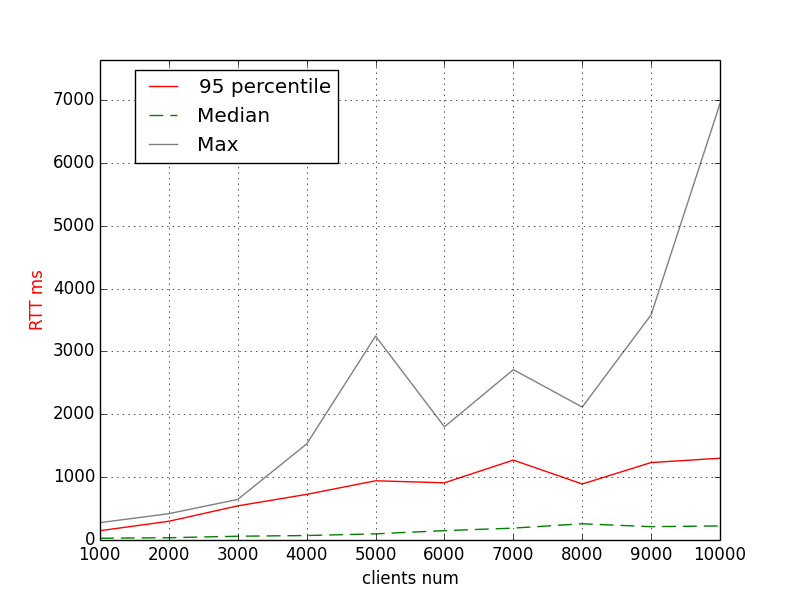
What about RTT?

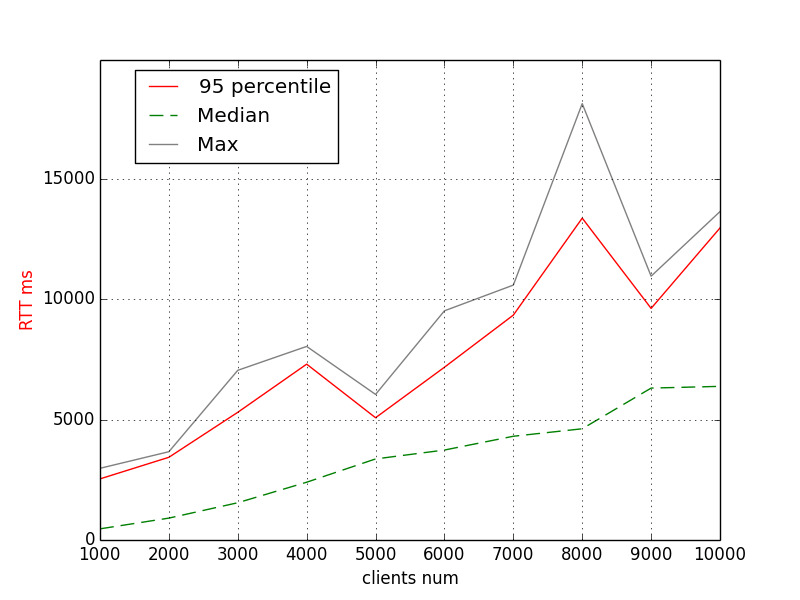
RTT (Ruby 2.6.2, default VM settings)
The 95th percentile is about 8s for 6K and 12s for 10K clients. Let’s remember these numbers.
NOTE: Why is it not monotonic? Mostly due to outliers (see the grey “Max” line). What causes this? We can only guess, and we will so keep on reading.
Action Cable + MALLOC_ARENA_MAX=2
First, memory usage:
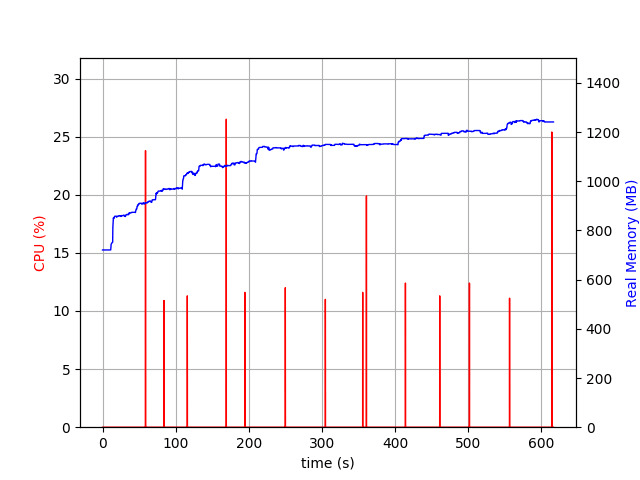
Memory (Ruby 2.6.2, MALLOC_ARENA_MAX=2)
Wow! Memory is growing much smoother and hardly reaches 1.3GB. Amazing, isn’t it?
Why haven’t I tried this simple trick before?
OK. Let’s take a look at the RTT chart:
RTT (Ruby 2.6.2, MALLOC_ARENA_MAX=2)
The 95th percentile shows ~7s for 6K and ~11s for 10K clients.
That means that both memory usage and performance is better with the less number of malloc arenas.
Note that the RTT is (almost) monotonic. That makes me guess that outliers in the first experiment could also be caused by heavy memory usage (longer GCs runs? allocations?).
Action Cable + malloc_trim(0)
Finally, let’s try the patch (that inspired me to run all these benchmarks in the first place):
Ruby 2.7-dev, malloc_trim patch
Memory usage is about 1.4GB—not bad, right? But take a look at the blue line—it looks like a handsaw! Memory goes up and down (not just up as usual), malloc_trim does the trick!
Let’s take a look at the performance:
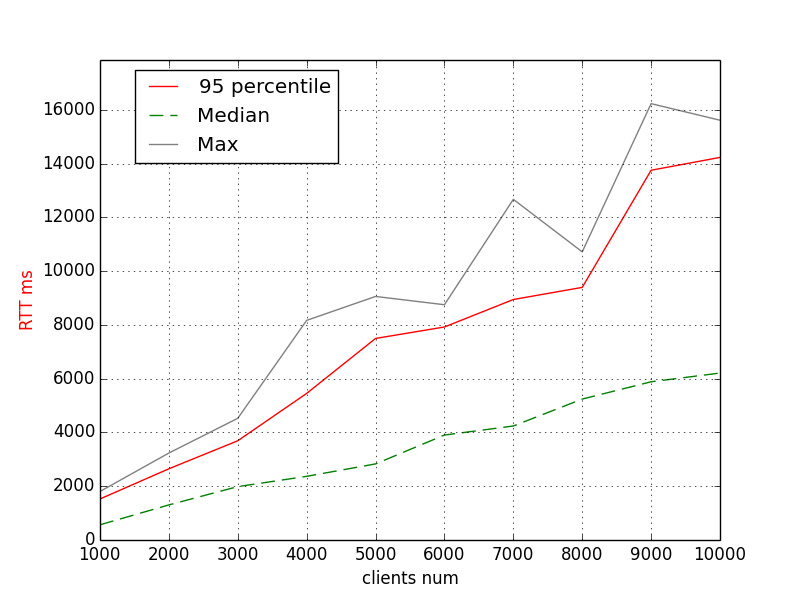
RTT (Ruby 2.7-dev, malloc_trim patch)
We have ~8s for 6K and ~14s for 10K as the 95th percentile values.
What? Performance decreased? Maybe, that’s because malloc_trim “can be painfully slow”?
Don’t panic, though. It needs more research. And more time for getting more results.
This benchmark is of integration type, we can only use it to generate hypotheses, for instance: “Although malloc_trim positively affects memory usage, it might negatively impact overall performance.”
So, what should I do with Action Cable?
First, if you don’t experience any issues with it—do nothing.
If you have some concerns regarding memory usage, first give MALLOC_ARENA_MAX=2 a fair try.
Didn’t help? Well, AnyCable is the next candidate.
UPD (03/22/2019): ksec pointed out that the benchmarks for AnyCable are missing. So, let’s add them.
Here is what we have for AnyCable, by the way:
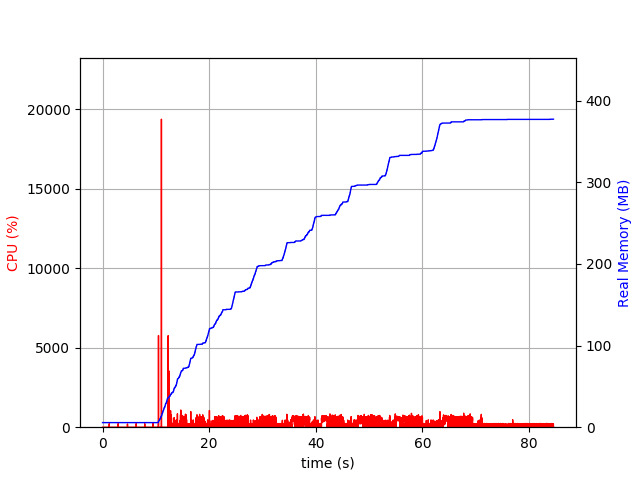
AnyCable memory usage
AnyCable RTT
P.S. Help me out in improving AnyCable by taking a small questionnaire—does not matter if you are an avid user or have just heard about this speedy drop-in replacement for Action Cable in production, I’d like to know what you think!

The next time I plan to experiment with jemalloc and GC.compact. Stay tuned!