Railing against time: tools and techniques that got us 5X faster tests


Topics

Translations
- Chinese一万年太久,只争朝夕
Slow testing is a drag for any project, but can be especially painful for enterprise-level projects operating at a large scale. This can lead to CI lagging, slower deployment times–and a developer experience that is just plain boring. Evil Martians recently helped a client optimize their CI pipeline, test and change their code faster, ultimately getting five times faster results! In this post, we’ll talk about some of the techniques and tools that made it happen–perhaps you’ll be inspired to do the same!
First, some background on our client: Power Home Remodeling (“POWER”) is the nation’s largest exterior home remodeler, specializing in exterior retrofits–including windows, siding, roofing, doors, attic insulation, and solar roofing panels. Both inside and out, it’s clear the company has high standards, so we set out to meet them.
Technically speaking, the project is built on Ruby on Rails and follows the component-based architecture design (aka modular monolith), with dozens of components.
A bird’s eye view of our optimization
To achieve this performance boost, we used a combination of RSpec hackery, profiling mastery (for instance, via Stackprof), and, of course, by using our own TestProf toolkit.
First, we conducted a preliminary examination of the whole test suite using Stackprof. That helped us identify some general things to improve: factories, logging, API calls, and so on. Then, after general optimizations, we switched to local test optimizations, for example, analyzing and refactoring specific test files.

Irina Nazarova CEO at Evil Martians
Overall, we submitted (and merged) three PRs, each of them bringing test suite improvements at different levels. In this post, we’ll walk you through these three optimization milestones.
The three pillars of the testing optimization mindset
So that’s the story, but let’s wait a second before we get too deep. Before optimizing tests, it’s important to understand the mindset required to get significant improvements. This mindset relies on the following three pillars.
First, search for the most valuable things to optimize. For instance, optimizing the users factory which is used across all tests will give much more value than optimizing a single monthly_report_spec.rb file (which is rarely changed or used).
Second, find low-hanging fruits and don’t over-optimize. It’s easy to get stuck on some method, and if it’s taking 4 hours to get a 1 second better test performance, you should reconsider your priorities here.
Third, measure timings and always compare timing before and after optimizations. There can be surprising increases, which is not really what we want.
Understanding the situation
First, we had to look at different kinds of metrics to get a clear overview and pinpoint any bottlenecks. Briefly, these metrics are: the total test time, the slowest methods in the call-stack and the most-used (and slowest) factories.
Setting up the tools
To start, we installed and configured Stackprof and TestProf. Stackprof is a call-stack profiler for Ruby, and TestProf is an advanced toolbox for profiling and optimizing tests (and again, which was created by Evil Martians!)
Remember: we need to keep records of our measurements. For us, our starting test suite run time was 53 minutes. How low do you think we can decrease this number? Try to guess, and read on to find the answer (warning: you might be surprised)!
Let’s get a high-level picture of “why it’s so slow” by looking at call stacks collected via Stackprof—and by the way, that’s the first thing to do when you’re dealing with a slow test suite.
Learning from the call stacks
The best way to read an application’s call stacks is to draw them as a flamegraph. To do so, we can load the result of the TEST_STACK_PROF=1 SAMPLE=1000 bin/rspec command into Speedscope, a flamegraph viewer that supports Stackprof and other profilers (that is, not only Ruby ones).
While actually mastering flamegraphs requires some time, the “Sandwich” view in Speedscope can give you some clues right away. In our case, we identified a couple of suspicious Active Record callbacks:
History#auto_add_history
NitroSearch::Elastic::Indexing
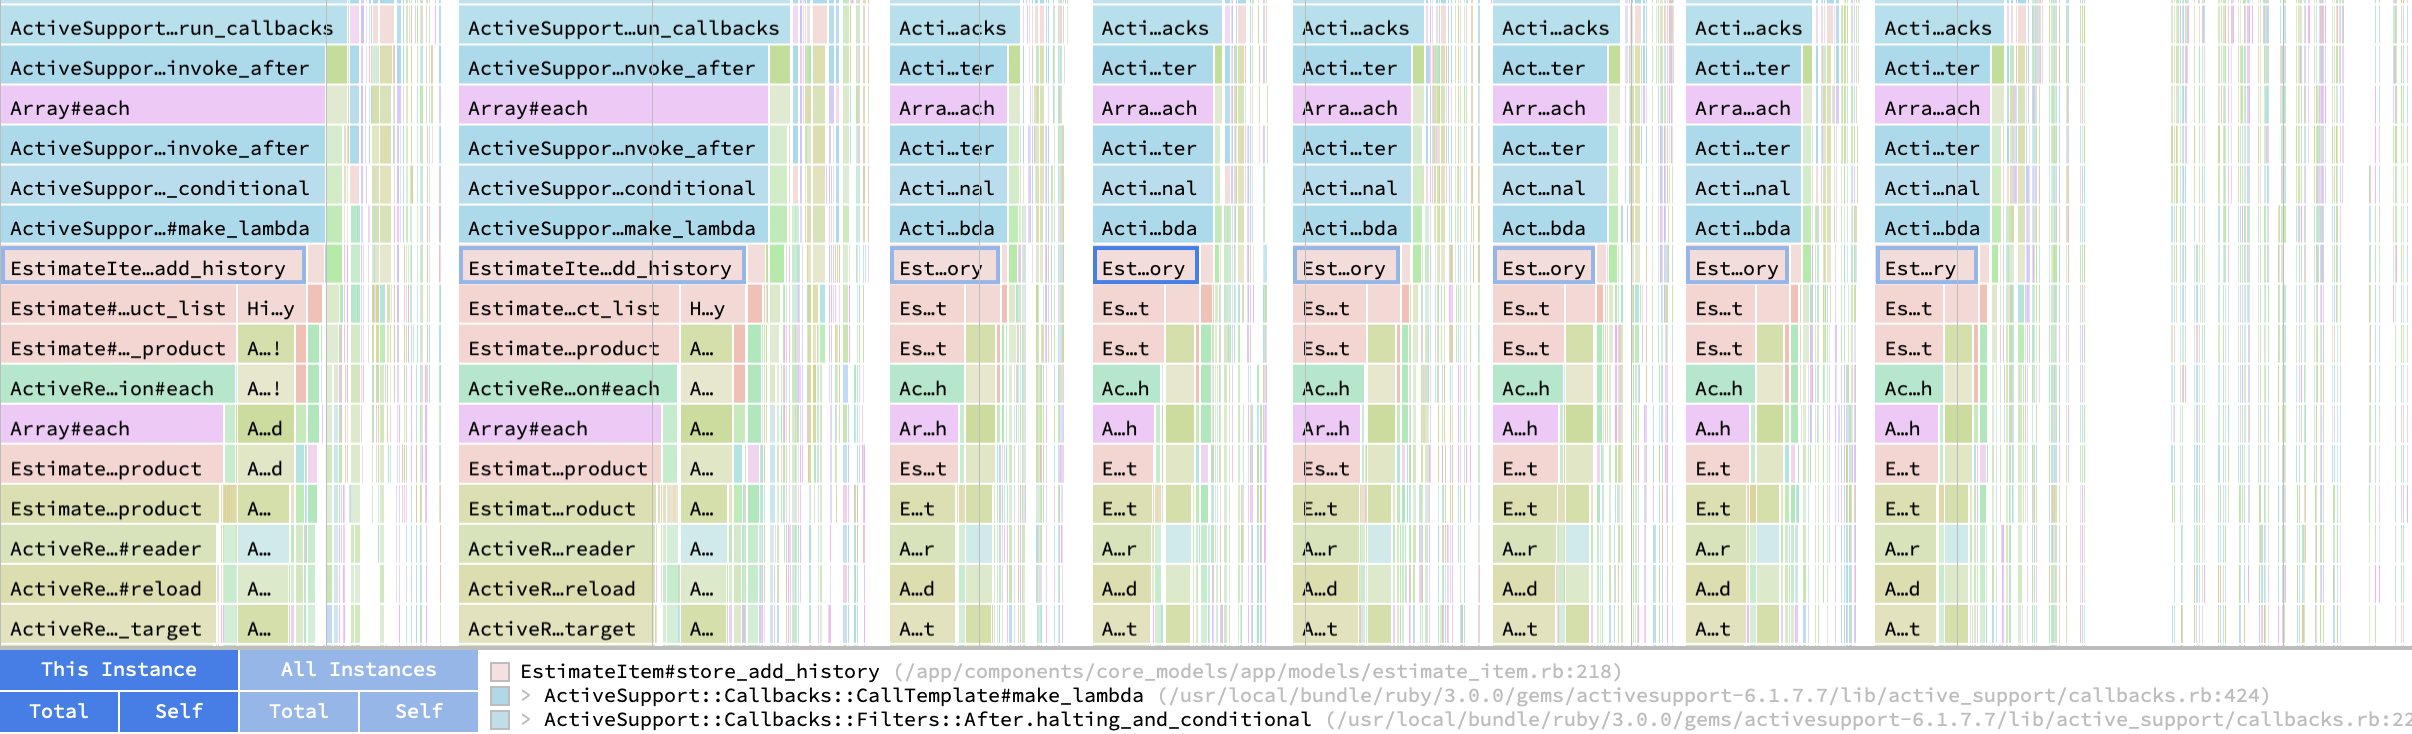
#auto_add_history on the call stack flamegraph
We can also see a lot of low-level Active Record calls (#exec_prepare, etc.) and factory-related calls (FactoryBot#create). Let’s take a close look at the factories using TestProf’s FactoryProf profiler.
Analyzing factories with FactoryProf
FactoryProf allows you to see which factories are most used and time-consuming (in our case, the project and estimate factories contributed to the test time the most).
There is also a very useful flamegraph-like profiler for factories (FPROF=flamegraph bin/rspec) that can highlight factory cascades:

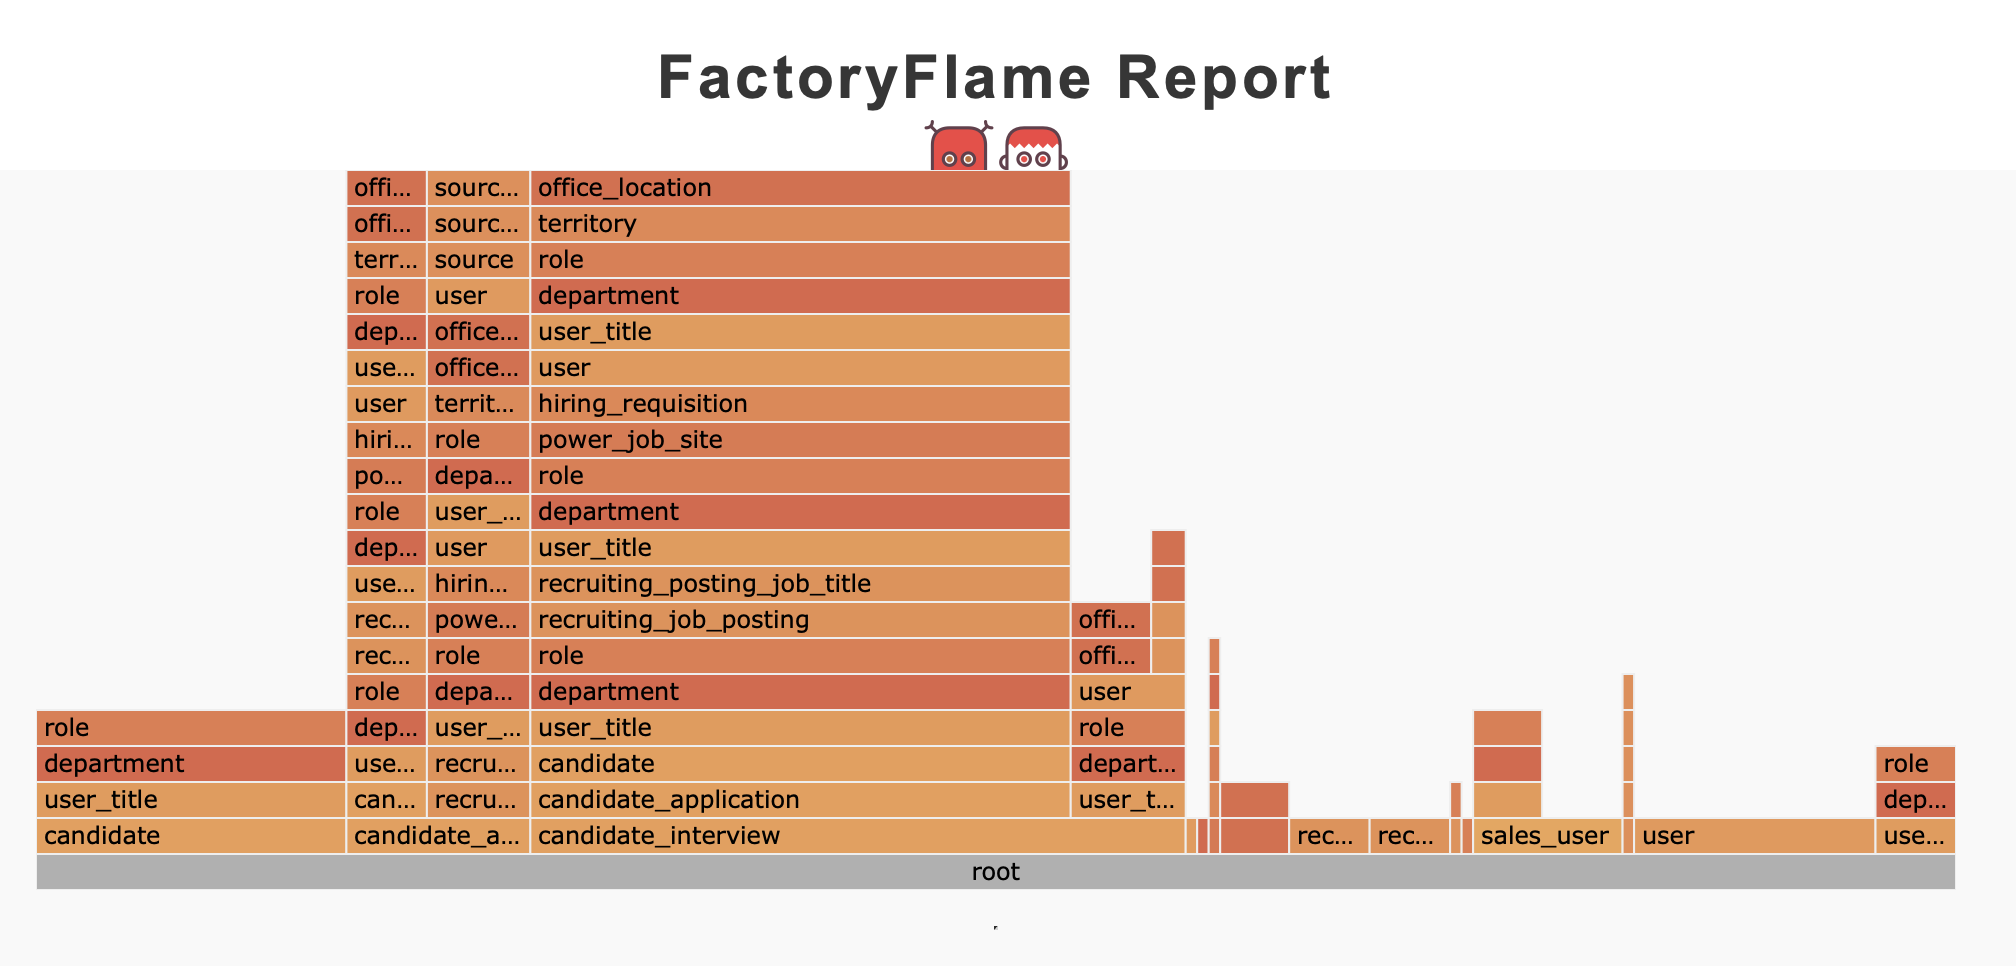
FactoryFlame before optimization
In the image above, you can notice one of the cascades: each time you call create(:candidate_interview), a lot of dependent records are created.
And we can also see that these cascades are caused by the repetitive creation of the project and estimate factories.
With this profiling information at hand, we started applying optimization patches one by one.
PR #1: General optimizations
We discovered that several Active Record callbacks (e.g., History#auto_add_history) were being called frequently throughout the test run. Yet, the corresponding side-effects are needed only in ~1% of all tests. Thus, to improve the test time, we can disable them in tests by default and only enable them when needed.
To do that, we applied the testability pattern: adding a special Testing module for the feature to control the invocation of the callbacks in tests:
# models/history.rb
module Testing
  class << self
    def fake? = @fake
    def fake! = @fake = true
    def real! = @fake = false
  end

  # ...
  def auto_add_history
    return if History::Testing.fake?
    # ...
  end
end
Here, we’re following the popular Sidekiq::Testing interface familiar to many Ruby developers. Now, in our rails_helper.rb we can do the following:
# spec/rails_helper.rb

# ...
History::Testing.fake!

RSpec.configure do |config|
 config.before(:each) do |example|
   if example.metadata[:auto_history] == true
     History::Testing.real!
   else
     History::Testing.fake!
   end
 end
end
And here, we use the RSpec tagging feature to conditionally toggle the callback behavior. Whenever we need to test some functionality that relies on the auto-history feature, we add the :auto_history to the corresponding test example:
# spec/models/history_spec.rb
describe History do
  let(:fp) { create(:finance_project) }

  it "automatically record history on creation", :auto_history do
    h = fp.histories.last
    expect(h.owner_changes["roofing_sold"]).to eq([nil, true])
    expect(h.activity).to eq("Created the Finance Project")
  end

  # ...
end
After we applied a similar technique to the NitroSearch::Elastic::Indexing module, we cut the total test time from 53 minutes down to 33 minutes. And that’s just the beginning!
PR #2: Optimizing factories
We found that two factories, project and estimate, were the slowest (according to the FactoryProf reports). We took a look at their source code and found that they have a common denominator—they both create home and owner associations by default:
factory :estimate do
  # ...
  home
  association :owner, factory: :user
end
What to do if you see something like this? Try commenting out the associations and see how many tests fail! In our case, the number wasn’t that big (~50 out of thousands of tests), so we proceeded to move association creation into the corresponding traits and use them when needed:
factory :estimate do
  # ...
  trait :with_home do
    home
  end
  trait :with_owner do
    association :owner, factory: :user
  end
end
And this is how the factories flamegraph looked after we removed unnecessary associations—the stacks got much lower (and the overall test time was reduced by another ~15%):

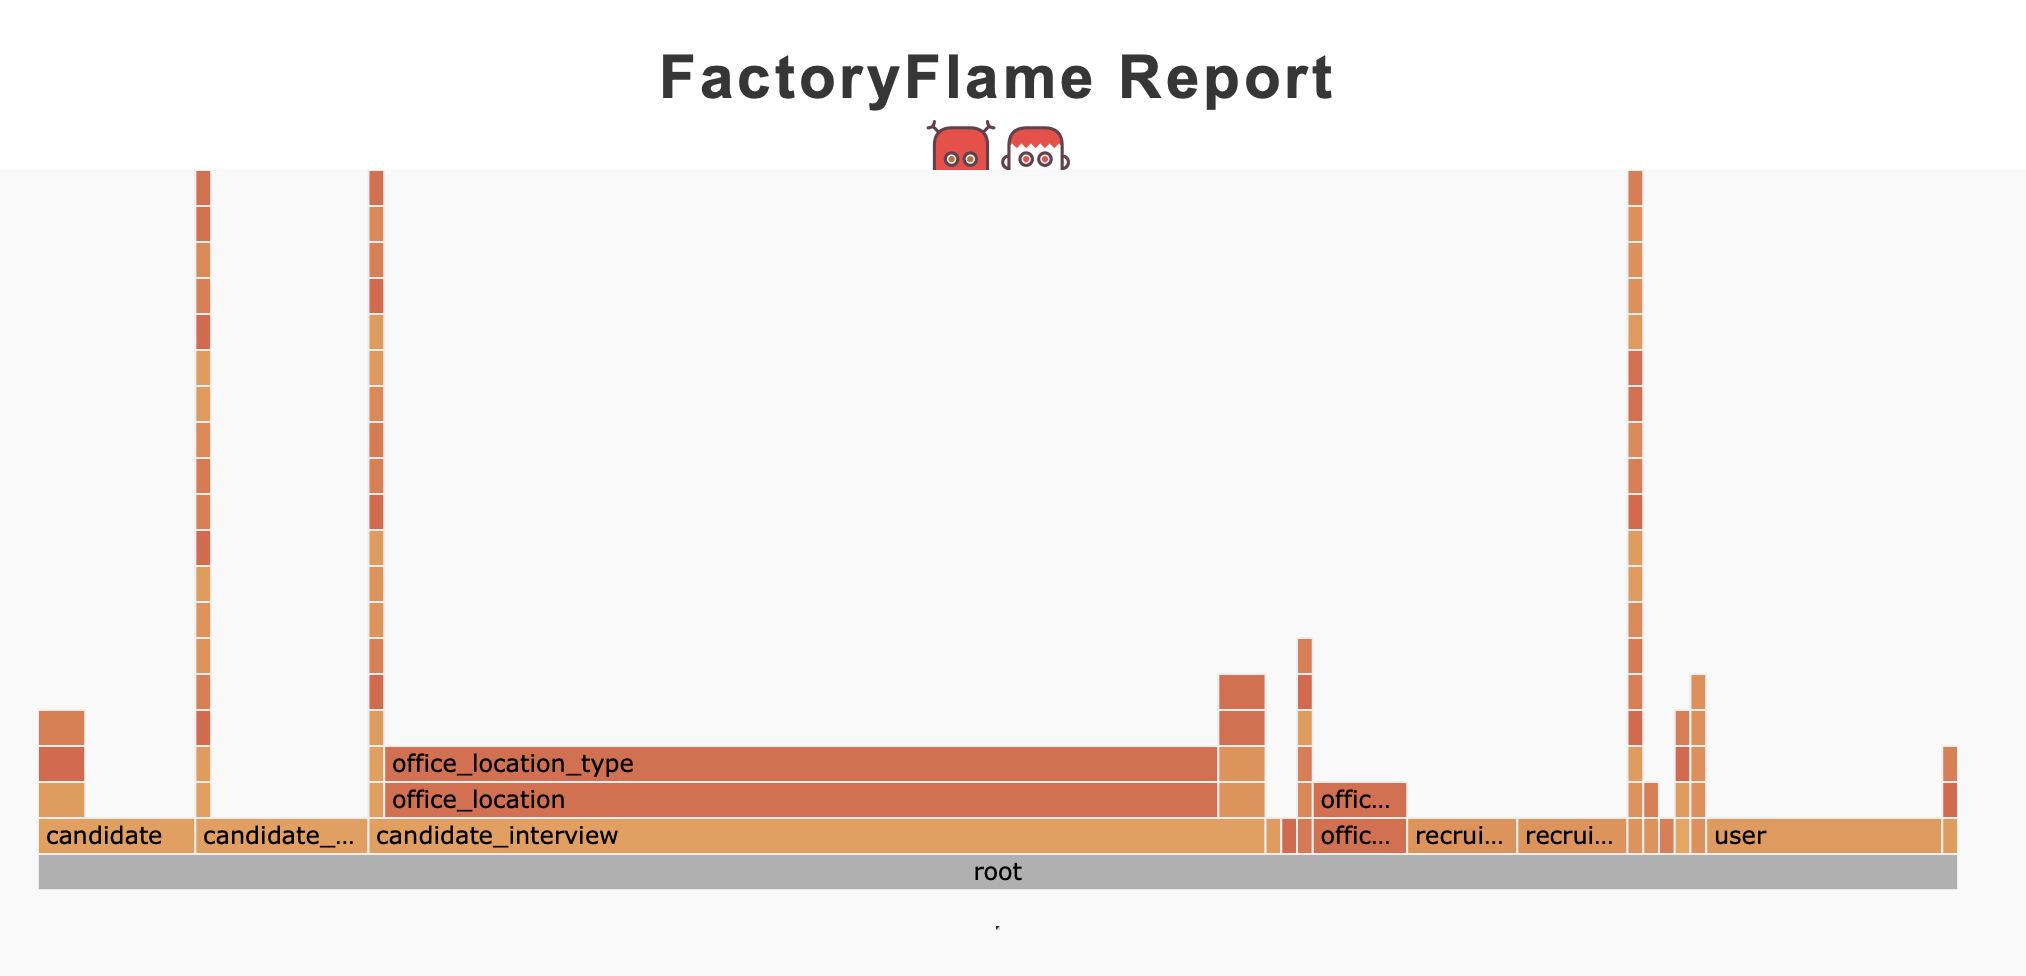
FactoryFlame after optimization
Fixturizing nitro_user
We also noticed that for almost every test, a default user was being created (User.current). The common idiom we found in tests was User.current || create(:nitro_user). Creating a user also involved creating some other factories, so the overhead of re-creating it all the time was quite noticeable.
We decided to move the default user creation into a fixture using TestProf’s AnyFixture tool:
# spec/nitro_user.rb

require "test_prof/recipes/rspec/any_fixture"
using TestProf::AnyFixture::DSL

RSpec.shared_context "fixture:nitro_user" do
  let(:nitro_user) { fixture(:nitro_user) }
end

RSpec.configure do |config|
  # Create a Nitro user for the whole test run
  config.before(:suite) do
    fixture(:nitro_user) { FactoryBot.create(:nitro_user) }
  end

  config.include_context "fixture:nitro_user"
end
After introducing the fixture, we removed all the explicit creation of User.current in tests in order to get another performance boost.
On the database state and its cleanness
While we were working on the nitro_user fixture introduction, we found that the database wasn’t exactly left in pristine condition after our test runs, even though transactional fixtures were used.
A quick search revealed a few before(:all) usage in tests, which we’ve replaced with before_all—a transactional version of the original RSpec hook.
We also introduced a convenient (and conditional) hook to reset the database state, so developers working in any other, not yet fixed, branches could easily fix global state issues:
RSpec.configure do |config|
  config.prepend_before(:suite) do
    # Truncate all tables to make sure we start with a clean slate
    ActiveRecord::Tasks::DatabaseTasks.truncate_all if ENV["CLEAN_DB"]
  end
end
Let’s also note that we’re using plain Active Record, with no third-party database cleaners involved.
In the end, our second PR resulted in the further test time reduction down to 21 minutes (as a reminder, after step one we were at 33 minutes, and originally at 53!).
But we didn’t stop there… we continued with more granular optimizations.
PR #3: Optimizing specific test files
We already introduced one of TestProf’s killer features, before_all, during the previous step, but the real power comes from its sibling—let_it_be. The let_it_be helper works similarly to let! (from the usage point of view) but with a big performance difference—the data is created once and then re-used by all the tests in the file (or within an RSpec context). So, we can see let_it_be as a local fixture.
Migrating to let_it_be must be done file by file. How to figure out where to start this migration, and which file to choose first?
For that, TestProf provides a specific profiler called RSpecDissect. It shows how much time tests spend in let/let! and before(:each) declarations:
Top 10 slowest suites (by `let` time):


HiringRequisition (./spec/models/hiring_requisition_spec.rb:5) – 00:04.126 (378 / 59) of 00:05.019 (82.21%)

...
The example report below shows that about a half of the run time of the spec/models/hiring_requisition_spec.rb file is occupied by let expressions. Let’s see how we refactored it!
…but, before doing any refactoring, we recorded the current state of the test file by capturing its factories profile via FactoryProf; the initial statistics we captured were as follows:
$ FPROF=1 rspec spec/models/hiring_requisition_spec.rb

Total time: 00:03.368 (out of 00:07.064)

  name                    total   top-level     total time

  user                      237         109        3.8929s
  office_location            86          41        2.3305s

  ...
Now, without going into a deep discussion of what this information told us, let see how we refactored the test:
- let(:office_location) { create(:office_location, territory: create(:territory)) }
+ let_it_be(:default_user) { create_default(:user) }
+ let_it_be(:office_location) { create(:office_location, territory: create(:territory)) }
What changed? First of all, we replaced let with let_it_be to ensure that an office_location record is only created once for the whole file. Additionally, we applied the create_default optimization, which allowed us to reuse the user record in all factory-generated objects that needed user associations.
To measure the effect of the change, we ran FactoryProf again and got the following results:
FPROF=1 rspec spec/models/hiring_requisition_spec.rb

Total time: 00:01.039 (out of 00:04.341)

  name                    total   top-level     total time

  office_location            11          11        0.1609s
  ...
As you can see, the total time decreased by 3 seconds (~50%) and the factories time decreased from 3s to 1s—not bad for a single file change!
We continued applying the let_it_be / create_default refactoring to other files and after approaching a few dozens of files (out of hundreds) we reached the satisfying 11 minutes.
To sum up, our three optimization steps helped us speed up tests by ~five times (from 53 to 11 minutes) in a matter of two working weeks. How do you like that? Feel free to reach out to us if you need help with slow tests!