Rails profiling story, or how I caught Faker trying to teach my app Australian Slang
Once upon a time (actually, a few days ago) I’ve been working on a small refactoring task: integrating factory_bot into mailer previews.
Seemed like a pretty simple task: load factory_bot_rails and include syntax methods:
# spec/mailers/previews/application_preview.rb

require "factory_bot_rails"

class ApplicationPreview < ActionMailer::Preview
  include FactoryBot::Syntax::Methods

  private

 # user record for previews
  def user
    @user ||= build_stubbed :user
  end
end
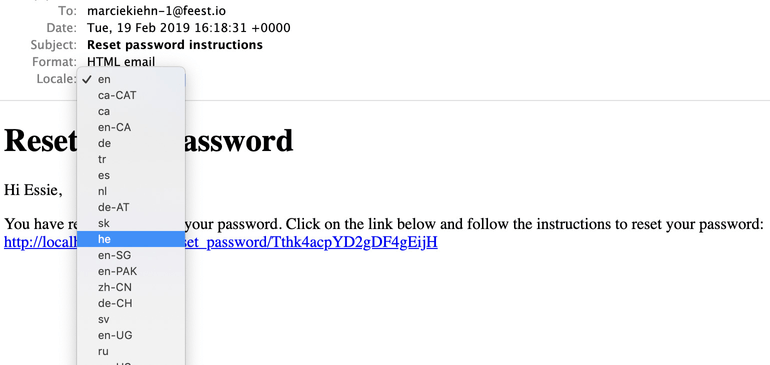
After doing that I’ve checked that everything is OK locally and found something strange:

Wow! We have plenty of locales! In our English-only app! That’s awesome!
No, it’s not.
I quickly found where this came from: the faker gem we use in our factories.
I’ve checked the repo and was a little bit surprised:
require 'i18n'

#...

I18n.load_path += Dir[File.join(mydir, 'locales', '**/*.yml')]
I18n.reload! if I18n.backend.initialized?
Faker loads all its locale files and doesn’t allow you to choose the only locale you want. That was an unexpected behavior to me.
NOTE: you can explicitly specify which locales you want to use in your application by setting config.i18n.available_locales; if it’s not set all the loaded locales would be available.
I decided to check how the loading of a bunch of unnecessary YML files affects the application boot time.
Since i18n loads locales lazily, I’ve added the following line to my rspec_helper.rb to do that forcefully:
# add to rails_helper.rb
I18n.backend.load_translations
NOTE: since we use faker in factories, we need locales almost in every test.
I’ve already had test-prof in my bundle, so profiling the boot time was as simple as running this one command:
$ SAMPLE=1 TEST_STACK_PROF=boot TEST_STACK_PROF_FORMAT=json bundle exec rspecLet me explain what happened here.
We “told” Test Prof to profile our test run using Stack Prof and boot mode.
In that mode, stackprof starts collecting samples right after loading and stops right before the first test runs (more precisely, in the RSpec before(:suite) hook).
We also pass SAMPLE=1 to execute only one random test (this feature is also provided by Test Prof): we don’t care about a particular example since we’re profiling the boot time.
Finally, TEST_STACK_PROF_FORMAT is used to generate a profiling report in JSON format (the feature has been added to stackprof itself, but hasn’t been released yet).
What to do with this JSON report? Let’s load it into Speedscope!
Speedscope is a flame graph viewer, which visualizes JSON reports generated by popular profilers (including stackprof).
NOTE: What are flame graphs and how to read them? Check out the “official docs” and also this talk by Miha Rekar.
That’s what I found:

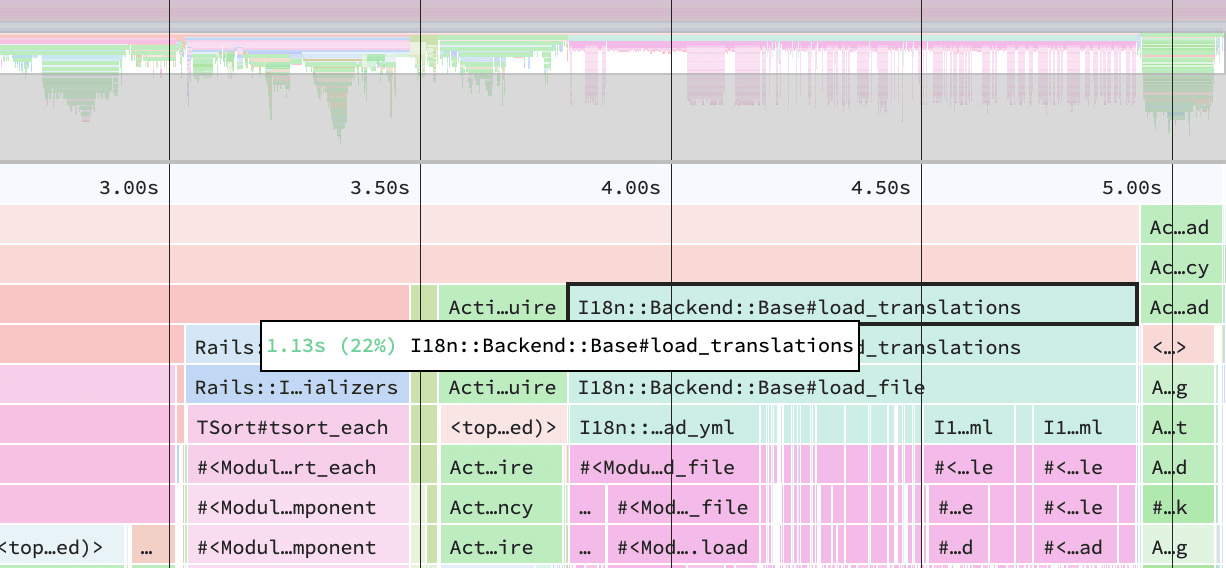
Default Faker behaviour (loading all translations)
We spent ~1.1s loading locales.
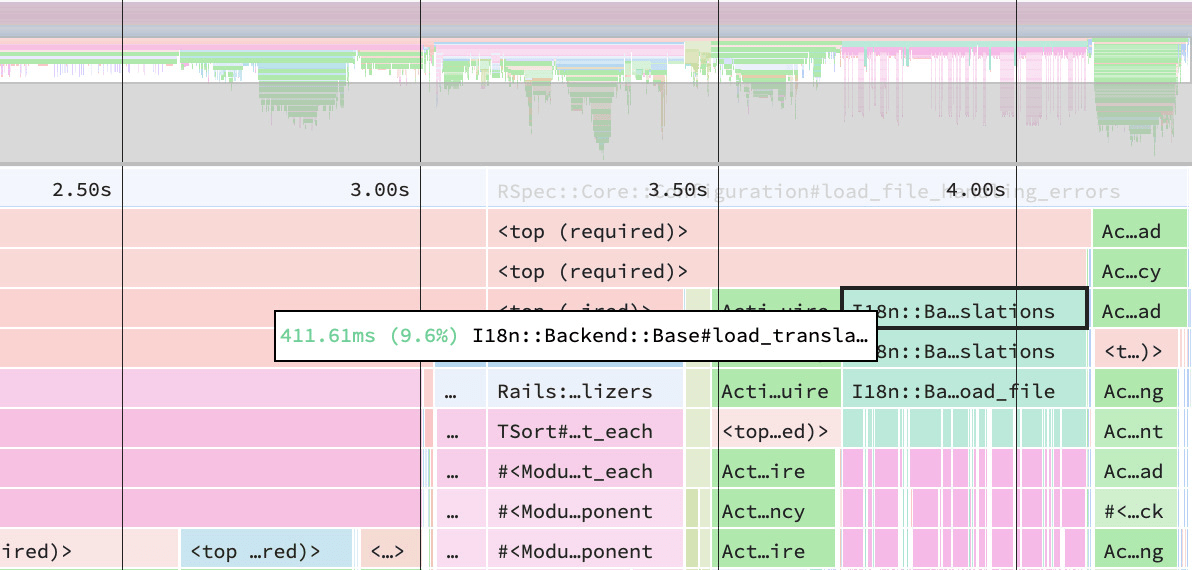
What if we only load English files (using this patch)?

Patched Faker (loading only English translations)
It only took ~0.4s to load locales.
Looks like it’s not a big deal 😕
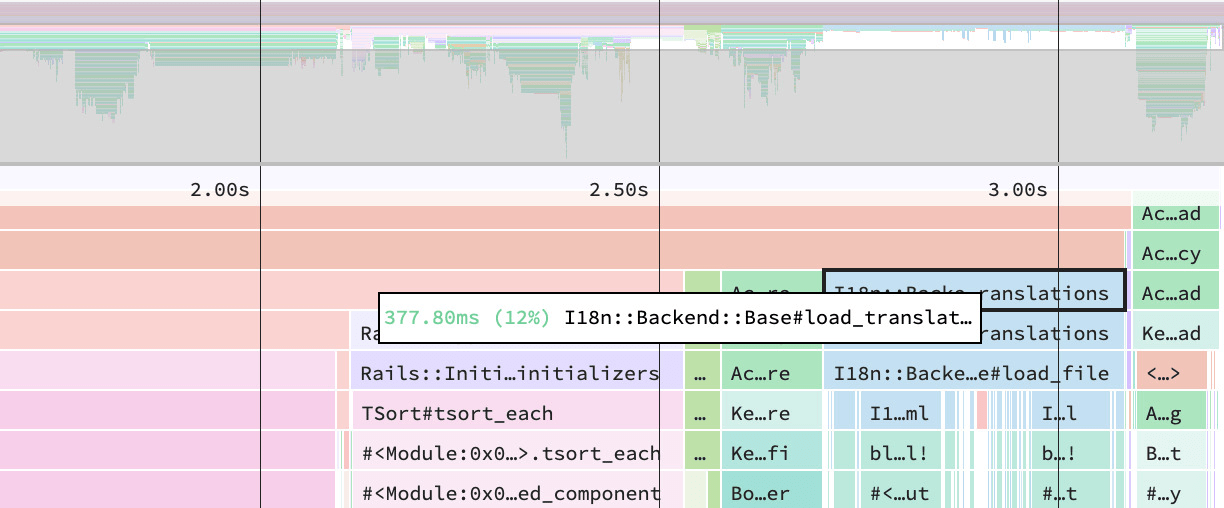
And if we add bootsnap we could achieve the same result without “patching” faker:

Default Faker with Bootsnap
Maybe, we waste a lot of memory?
Let’s try to measure the memory footprint using memory_profiler gem:
require "memory_profiler"

MemoryProfiler.report do
  I18n.backend.load_translations
end.yield_self(&:pretty_print)
When loading all available locales:
retained objects by gem
-----------------------------------
 147586 psych
 5462 i18n-1.5.3
 2 activesupport-6.0.0.beta1

retained objects by class
-----------------------------------
 148628 String
 2550 Array
 1022 Symbol
 848 Hash
 2 Proc
And English only version:
retained objects by gem
-----------------------------------
 44301 psych
 3418 i18n-1.5.3
 2 activesupport-6.0.0.beta1

retained objects by class
-----------------------------------
 45240 String
 1202 Array
 910 Symbol
 367 Hash
 2 Proc
So, 2.6MB vs. 7.8MB—the difference is negligible. Again.
We must admit that in this particular case, our profiling didn’t reveal any significant issues.
And that could also be considered a happy end 🙂
P.S. Also check out these posts on profiling with Test Prof: “A good doctor for slow Ruby tests” and “Factory therapy for your Ruby tests”.
P.P.S. Yes, Faker really supports Australian Slang.

