TimescaleDB: integrating time-series data with Ruby on Rails

Imagine you’re working on a project for an advertising platform, and you’ve been tasked with implementing a reporting service which will perform an analysis on each client’s active ad over a certain period of time. To that end, you’ll need to collect a large amount of data about every ad view, then aggregate this data and join it across multiple tables to filter out inactive ads and clients. Using common SQL practices, this becomes a surprisingly difficult task; it’s made twice as challenging with NoSQL systems. Instead of dealing with these headaches, there’s another way: TimescaleDB. If you’re ready to learn about time-series data and TimescaleDB, there’s no time like the present—keep reading!
TimescaleDB is an open-source database designed to harness the full power of SQL relational databases to work with time-series data. A relatively recent addition to the database market, TimescaleDB hit the scene about 4 years ago, with version 1.0 launching at the end of 2018. Despite its relative youth, TimescaleDB is based on a mature RDBMS system, so it’s been fairly stable to date.
Moving from history to specs, TimescaleDB is an extension for PostgreSQL written in C. And if it’s good ol’ Postgres, that means you don’t have to find or write yet another ORM connector. This extension allows us to achieve 10-100x faster time-series data access and insertion than PostgreSQL, InfluxDB, or MongoDB. At the same time, it’s also capable of achieving scalability in ways previously available only to NoSQL databases. Moreover, TimescaleDB also provides data compression, saving you from excessive costs when storing large amounts of data. And, if compression is not enough, then downsampling data will come to the rescue.
In this article, I’ll break down the difference between time-series and regular data, and I’ll explain how TimescaleDB works. Further, using an example which displays visit statistics, I’ll demonstrate how to implement and integrate TimescaleDB into an existing Ruby on Rails application. By the way, we also utilized TimescaleDB to store stats, ratings from users, and other relevant time-series data in our project, FEED, a new social app for iOS. You can read the whole story here.
Skip ahead:
- Understanding time-series data
- A high level overview of TimescaleDB
- Integration with Ruby on Rails made easy
- Implementing a view counter
Understanding time-series data
So, what exactly is this “time-series data” we talked about earlier, and how does it differ from regular data? To start, time-series data is data which represents how a system, process, or behavior changes over time. This data can come in the form of web page visit statistics, CPU telemetry data, or currency quotes. Said another way, time-series data are statistical parameters describing the values of any processes collected at successive points in time.
The key way we can differentiate time-series from other types of data (for instance, regular relational business data) is that the former is typically inserted, but not overwritten. You might note that such data could be ingested and stored in a typical Postgres database as per usual, but TimescaleDB provides greater performance even when using equivalent hardware, and offers several convenient features specific to time-series data.
Deciding to use TimescaleDB
One of the main difficulties of introducing a new type of database system (like InfluxDB or MongoDB) is bringing a new query language into the project. Doing this can require a lot of time in order to study the new language. Conveniently, the primary feature which distinguishes TimescaleDB from other popular time-series database (TSDB) systems is that it uses familiar, tried-and-true SQL. This means the database supports the full range of SQL queries: aggregate functions based on time, table joins, subqueries, secondary indexes, and even window functions. So, if your application is already using Postgres, you really don’t need to put in significant effort when changing over to TimescaleDB.
In this article, I won’t go into very specific detail explaining how TimescaleDB works from the inside out. And actually, there’s really no need to do that, because that’s already been well documented. Nevertheless, let’s give a quick overview of TimescaleDB’s most important features.
Hypertables
One key TimescaleDB feature is the hypertable. A hypertable is a table partitioned by a certain field, consisting of chunks. Chunks are inherited sections which store data for a certain period of time. The parent tables do not contain any data themselves. The Postgres planner analyzes an incoming SQL query and routes it into the proper chunk based upon the query’s conditions. This features allows us to work with multiple chunks in parallel, thereby speeding up query execution time.
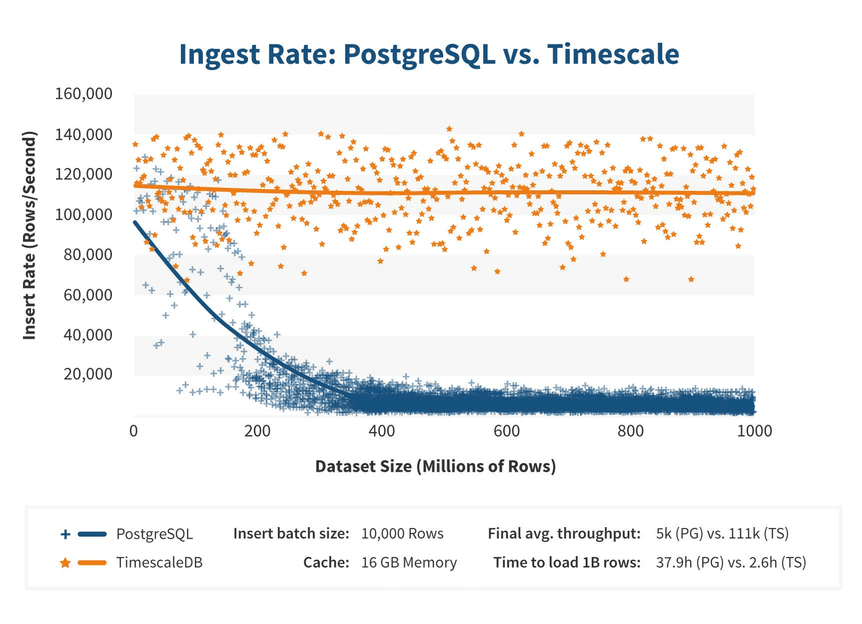
TimescaleDB uses a more efficient algorithm whenever it inserts a large amount of data, allowing for consistent performance. To contrast, whenever a regular Postgres database attempts to insert dozens of millions of rows, significant performance problems begin to occur. Meanwhile, TimescaleDB is able to retain nearly constant efficiency.

Ingest rate: Postgres vs Timescale (source)
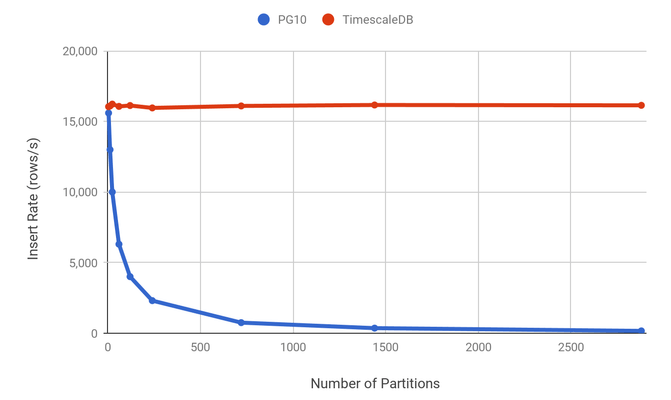
Postgres 10 introduced declarative partitioning, which simplified partition creation within tables. What did this change give us in terms of usability and insertion speed? First of all, with Postgres, as more and more new data comes in, you need to manually create partitions and indexes, whereas TimescaleDB takes over this task entirely. With regards to insertion speed, TimescaleDB also has the advantage here; it’s optimized for time-series data insertion because the most recent chunk is always fully located in RAM.
Additionally, TimescaleDB has its own tuples router. While Postgres 10 has made steps forward by writing a new tuples router, it still opens all child tables and indexes upon new row insertion. Accordingly, when insertion rates are increased, this can cause significant performance problems.

Ingest rate: Postgres declarative partitioning vs Timescale (source)
Continuous aggregates
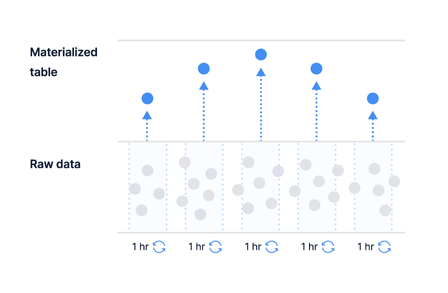
Continuous aggregates are based on materialized views in Postgres. These are background workers built into the database that can group data by a schedule. For instance, you could run a query every 24 hours to aggregate the previous day’s rows and to calculate the average values within each group. This approach speeds up frequent, large queries, reducing the time to scan and group a large number of rows. The continuous aggregate only updates new rows on each run. Interestingly, when querying rows from a continuous aggregate, it also merges “hot” data, the data not yet aggregated during the previous run.

TimescaleDB continuous aggregates (source)
Retention policies
In order to save disk space when using TimescaleDB, we can set up data retention policies to automatically delete rows that are older than a specified time (i.e. data that is more than 10 years old). Likewise, these policies can be used to delete rows from hypertables or continuous aggregates.
Such data policies are useful, for instance, when you need to store statistics for each blog post view, but you don’t require as much precision for an older period of time. This process is referred to as data downsampling. When doing this, a data retention policy is assigned to a hypertable for a specific interval, and then a continuous aggregate is created. If data is deleted from the hypertable for a particular period, the aggregated data in the materialized view won’t be deleted.
Performing the initial TimescaleDB setup
As mentioned before, under the hood, we’re actually dealing with Postgres. As such, we shouldn’t need to find and implement a new Active Record adapter just to install the TimescaleDB extension. Of course, as is often the case, things might not work out so simply. For example, when using Google Cloud Postgres, you’re only able to install the standard extensions. Further, generally speaking, TimescaleDB will never appear there (or on any other cloud solution) due to licensing restrictions.
In light of this, we’ll configure our database.yml file in order to use TimescaleDB as a separate database. In addition, we’ll also make use of a new feature from Rails 6 which allows us to do just that. Let’s shed some light on the reasons why we have to do this. The primary catalyst is the fact that TimescaleDB cannot do a proper schema dump. As we know, Rails uses pg_dump in structure.sql mode to dump the current database schema and then use it on a test database when running tests. The main database will be dumped as usual, but the new database will be initialized from migrations every time, and we’ll also turn off the automatic schema dump.
There’s also another reason why I prefer putting TimescaleDB into a separate database. That’s because in a mature project, it’s likely that the size of a time-series database would be larger than the primary database. If we organize things with a separate database, if the need arises and we have to perform an emergency recovery of the main database, this process will be way faster!
So, enough prep talk! Let’s get started. First, we’ll configure config/database.yml:
_primary: &primary
  adapter: postgres
  url: <%= ENV["DATABASE_URL"] %>

_statistics: &statistics
  adapter: postgres
  url: <%= ENV["TIMESCALE_URL"] %>
  schema_dump: false
  migrations_paths:
    - db/statistics_migrate

development:
  primary:
    <<: *primary
  statistics:
    <<: *statistics

test:
  primary:
    <<: *primary
    url: <%= ENV["DATABASE_URL"] + "_test" %>
  statistics:
    <<: *statistics
    url: <%= ENV["TIMESCALE_URL"] + "_test" %>

production:
  primary:
    <<: *primary
  statistics:
    <<: *statistics
Take a look at the schema_dump option—it disables schema dumping for the statistics database. Unfortunately, it will only work in Rails 7.
We’ve almost completed the setup. We still need to implement a base model for our statistics database.
To do this, let’s create app/models/statistics/application_record.rb:
module Statistics
  class ApplicationRecord < ::ApplicationRecord
    self.abstract_class = true

    connects_to database: { reading: :statistics, writing: :statistics }
  end
end
Implementing a view counter
Now that we’ve gotten things set up, we’ll move on to properly building out our demo. For that, let’s imagine we need to implement a view counter to track blog posts. Additionally, we should be able to display these statistics organized by days. It seems that developers have to reckon with such tasks rather frequently—and I’ll show you how to implement this now.
Since we’ve defined the statistics database as separate entity, we have to create a migration in the db/statistics_migrate folder. Adding the option --db statistics to our command will help us do just that:
rails g migration create_post_views --db statisticsWith that done, let’s move on and create a table:
class CreatePostViews < ActiveRecord::Migration[6.0]
  def up
    create_table :post_views, id: false do |t|
      t.timestamp :time, null: false
      t.bigint :post_id, null: false

      t.index %i[post_id time]
    end

    execute <<~SQL
      select create_hypertable('post_views', 'time');

      select add_retention_policy('post_views', interval '1 week');
    SQL
  end

  def down
    drop_table :post_views
  end
end
Let’s take a look at some key elements above:
- We created a table using
create_table :post_views. - Further down, we use
select create_hypertableto declare it as a hypertable so it will automatically be partitioned. - Following this, we configure a data retention policy using
select add_retention_policy, since we’re planning to perform a weekly downsampling.
We’ll create a materialized view for this:
rails g migration create_post_daily_views --db statisticsAgain, now that we’ve created a migration in the proper folder, let’s implement the table:
class CreatePostDailyViews < ActiveRecord::Migration[6.0]
  disable_ddl_transaction!

  def up
    execute <<~SQL
      create materialized view post_daily_views
      with (
        timescaledb.continuous
      ) as
      select
        time_bucket('1d', time) as bucket,
        post_id,
        count(*) as views_count
      from post_views
      group by bucket, post_id;
    SQL

    execute <<~SQL
      select add_continuous_aggregate_policy(
        'post_daily_views',
        start_offset => INTERVAL '1 day',
        end_offset => INTERVAL '1 hour',
        schedule_interval => INTERVAL '1 hour'
      );
    SQL
  end

  def down
    execute "drop view post_daily_views cascade"
  end
end
What are the important points to note in the code above?
disable_ddl_transaction!: we have to disable the migration transaction because creating materialized views within it is not allowed.time_bucket: this is a more powerful version of the standard Postgresdate_truncfunction. The return value is the bucket’s start time. The bucket field is required to be present in the grouping conditions. We won’t pay any mind to indexes here because they’ll be created automatically based on the grouping conditions’ fields.add_continuous_aggregate_policy: this registers the continuous aggregate to run every hour on schedule. Also, a data time window is configured here.
Next, we need to implement a counter that will track the total views of each blog post. This is actually an unusual task for TSDB systems because they assume that you’re just going to request data for a specific period. You cannot simply write select count(*) from post_views where post_id = ?, because it will have to scan the chunks from all time periods. The latest TimescaleDB v2 brought with it the ability to register user-defined functions, executed by a schedule. So, let’s take advantage of that.
We’ll create a table to store the total views of each blog post:
rails g migration create_post_total_views --db statisticsWe created a new migration, and now we’ll implement the table:
class CreatePostTotalViews < ActiveRecord::Migration[6.0]
  def change
    create_table :post_total_views do |t|
      t.bigint :post_id, null: false
      t.integer :views_count, null: false, default: 0
      t.datetime :updated_at, null: false

      t.index :post_id, unique: true
    end
  end
end
Next, let’s generate the migration that will use the raw data from post_views and create a rollup in post_total_views:
rails g migration rollup_post_views --db statisticsThen we’ll create and register our SQL function:
class RollupPostViews < ActiveRecord::Migration[6.0]
  def up
    execute <<~SQL
      CREATE OR REPLACE PROCEDURE rollup_post_views (job_id int, config jsonb)
      LANGUAGE PLPGSQL
      AS $$
      DECLARE
        watermark timestamp;
      BEGIN
        select jsonb_object_field_text(config, 'watermark')::timestamp into strict watermark;

        insert into post_total_views (post_id, views_count, updated_at)
          select post_id, count(*) as views_count, current_timestamp
          from post_views
          where time > watermark and time <= current_timestamp
          group by post_id
        on conflict (post_id)
        do update set
          views_count = post_total_views.views_count + excluded.views_count,
          updated_at = current_timestamp;

        perform alter_job(job_id, config => jsonb_set(config, array['watermark']::text[], to_jsonb(current_timestamp)));
      END
      $$;

      select add_job('rollup_post_views', '15m', config => '{"watermark": "1970-01-01"}')
    SQL
  end
end
At first glance, the file above might look a little bit complicated, so let’s go through the code and discuss what it does.
First, we extract the most recent execution time from the passed watermark option. We then aggregate the fresh views that were saved into post_views after the aforementioned execution time. We insert them into the post_total_views table using the upsert approach: if there’s no row in the table, it will be created, otherwise, it will be updated. And finally, we save the current transaction time back to config.
For the last step, let’s write the models which correspond to the tables and views above. These will be written in the standard Rails way.
We’ll create a model storing raw data:
module Statistics
  class PostView < ApplicationRecord
    validates :time, presence: true
    validates :post_id, presence: true

    class << self
      def increment(post_id)
        create!(
          time: Time.current,
          post_id: post_id
        )
      end
    end
  end
end
Next, we’ll create a model for the materialized view storing aggregated views by days:
module Statistics
  class PostDailyView < ApplicationRecord
    scope :for_week, ->(time) do
      where(bucket: time.at_beginning_of_week..time.at_end_of_week.at_beginning_of_day)
    end
  end
end
And finally, we’ll create a model storing total views of each blog post:
module Statistics
  class PostTotalView < ApplicationRecord
  end
end
And with that, the main portion of our work on this demo is complete. A bit later, if you so choose, you could implement the business logic to actually increment the counter on your own. Something like as follows:
class PostsController < ApplicationController
  def show
    @post = Post.find(params[:id])
    Statistics::PostView.increment(@post.id)
  end
end
And of course, alongside this, you’d want to add everything necessary to beautifully display the charts themselves (for instance, the great Chart.js library).

And then, after all is said and done, your controller might look something like this:
class PostInsightsController < ApplicationController
  def show
    @post = Post.find(params[:id])
    @total_views = PostTotalView.find_by(post_id: @post.id)&.views_count
    @current_week_views = PostDailyView.for_week(Time.current).where(post_id: @post.id)
  end
end
🕔 Wow, time flies when you’re having fun, no? Let’s wrap things up.
Conclusion
So, that’s that! We’ve seen that performing the initial setup of TimescaleDB and integrating it into Ruby on Rails were quite simple. There were practically no differences from working with vanilla Postgres. Still, there are some problems with schema dumping, but hopefully it will be fixed in the future.
Bottom line: is it worth using TimescaleDB for storing statistics and counting analytics? Definitely, yes! 👍 Despite its relative youth, TimescaleDB has come a long way, and it is quite stable at present.
Comms Pro: building a social video app for FEED


