Meet Yabeda: A Ruby instrumentation framework


Adopt metrics-driven development today with a drop-in open source framework and a family of gems that makes instrumenting Ruby web applications a breeze and works with Rails, Sidekiq, and Prometheus out of the box. Learn how Yabeda changed the way we monitor background jobs in one of the products we develop for eBay and adapt it to your own use case.
In our previous article dedicated to instrumenting Rails applications with Prometheus, we urged everyone to embrace a “metrics-driven development” mindset that will make your (and everyone’s on your team) life easier after an application is deployed to production.
We shared a belief that thinking about possible bottlenecks and ways to detect them while still in development will reduce your support costs significantly after a push to production.
As we described a sequence of steps necessary to collect Rails application data, we realized that writing boilerplate code for that becomes daunting quickly. So this article is less talk, more work.
We are proud to introduce Yabeda—a family of Ruby gems based on an extendable framework that helps you make your first step towards MDD with minimal effort.
All you need to do to gauge Rails and Sidekiq performance and push instrumentation data to one of the supported data-stores (Prometheus integration comes out of the box) is to drop a few lines of code in your current application, and run bundle install. If you feel like extending the built-in functionality, the modular structure of the framework makes creating your own plugin rather straightforward, so PRs are welcome!
In this article, we will take Sidekiq metrics as an example of things almost any production Rails application has to track and demonstrate how a combination of Yabeda, Prometheus and Grafana paves the way to designing exhaustive dashboards that allow you to keep your hand at the application’s pulse at all times.
First, we are going to show you how things can be hand-rolled (which is, in fact, a look at Yabeda’s internals), and then we will demonstrate how the same can be achieved without any boilerplate code.
TL;DR (try it yourself)
If you know your way around Docker and Docker Compose, feel free to clone an example Rails application, run it on your localhost and see Yabeda in action right away!
If you are not yet familiar with the subject matter, Prometheus is a highly configurable open source systems monitoring and alerting toolkit originally built at SoundCloud. It is a tool for collecting metrics, while Grafana turns plain text feed from Prometheus into graphs to be represented on a handy dashboard.
The provided example pulls in necessary Prometheus and Grafana distributions and sets them up automatically. If you already have both tools installed locally and know how to configure them—then the only thing you need is one of Yabeda’s gems.
Putting Sidekiq on the spot
We did not pull an idea for Yabeda out of thin air, one of the products we work on since long time: eBay for Business, relies on background jobs heavily. We can not divulge how much data we process precisely, but let’s say we had surpassed our first billion Sidekiq tasks a while ago.

Default Sidekiq dashboard as we know and love it
Sidekiq has a familiar built-in dashboard that can be found at the /sidekiq endpoint. However, if you run a production application at scale, you quickly come to a realization that while the provided data (total process task count, failed task count, current queue size, and few more metrics) is enough for detecting that something went wrong, it is certainly not sufficient to properly investigate problems. Also, it can not alert you once things start going south. It also does not give you any history on the sizes of your queues or failed/retry/dead/scheduled sets.
From our experience, once the reports about the problem are in, most useful metrics are:
- The time required for executing a single job (an average or, even better, a 95th percentile). Segmenting those values by worker class names helps to find a non-optimal implementation or a worker gone rogue.
- Job count in a queue per originator (can be a rake task, web request, other job or someone just fired
rails consolein production).
They are absent in a default Sidekiq dashboard, but with Prometheus, anything can be tracked! However, writing a Ruby implementation for that from scratch in a clean, maintainable way definitely requires some trial and error.
Read on to see a solution we came up with before extracting it into the Yabeda framework.
Prometheus rising
In our previous article, we have already introduced Prometheus’ basic metric types. If we are to adopt Prometheus for book-keeping, we need to set our mind on a right type for each metric and compose our registry (a list of everything we are tracking).
For a plain count of jobs added to queues, a counter would be the first choice. You could write something like:
registry = Prometheus::Client.registry
registry.counter(
  :sidekiq_jobs_enqueued_total,
  "A counter of the total number of jobs sidekiq enqueued."
)
Keep in mind that counters in monitoring solutions are quite special: they can only go one way: up or down (which is still technically “up”, but with negative values).
Strictly speaking, counters in Prometheus, NewRelic or DataDog are implemented as a Conflict-free Replicated Data Type called a G-Counter. Values coming from various sources can be merged without conflicts (it is mathematically proven). This allows monitoring software to not care about state loss at all: things just keep being added up after reset. If you want to keep track of a value that can be decremented, you need to compose two G-Counters: one for increment, one for decrement.
To keep track of job execution times, we need to put together more information: something that will allow us to compute percentiles and averages. The best fit would be a histogram type.
registry = Prometheus::Client.registry
registry.histogram(
  :sidekiq_job_runtime_seconds,
  "A histogram of the job execution time measured in seconds.",
  {}, # default labels
  [
    0.005, 0.01, 0.025, 0.05, 0.1, 0.25, 0.5, 1, 2.5, 5, 10, # standard buckets
    30, 60, 120, 300, 1800, 3600, 86_400 # Sidekiq tasks may take long time!
  ].freeze
)
Internally, histograms are merely composed out of several counters. One with a count of measurements, one with a total sum of measured values, and few more recording the distribution of observed values by buckets. It is a simple, compact, yet powerful structure that allows for precise measurements. Note that Sidekiq jobs can take quite a long time (as opposed to HTTP requests, for instance), so we also need to enhance a standard set of buckets to add more scales to our histogram.
And for the rest of the registry (note these are the exact metrics that come by default with yabeda-sidekiq):
registry = Prometheus::Client.registry
registry.counter(:sidekiq_jobs_executed_total, "A counter of the total number of jobs sidekiq executed.")
registry.counter(:sidekiq_jobs_success_total, "A counter of the number of jobs successfully processed.")
registry.counter(:sidekiq_jobs_failed_total, "A counter of the total number of jobs failed in sidekiq.")
registry.gauge(:sidekiq_jobs_waiting_count, "The number of jobs waiting to process in sidekiq.")
registry.gauge(:sidekiq_active_workers_count, "The number of currently running machines with sidekiq.")
registry.gauge(:sidekiq_jobs_scheduled_count, "The number of jobs scheduled for later execution.")
registry.gauge(:sidekiq_jobs_retry_count, "The number of failed jobs waiting to be retried")
registry.gauge(:sidekiq_jobs_dead_count, "The number of jobs exceeded their retry count.")
registry.gauge(:sidekiq_active_processes, "The number of active Sidekiq worker processes.")
registry.gauge(:sidekiq_default_queue_latency, "Default queue latency.")
Now when we know what things we want to track and by what means, it is time to make our Sidekiq actually send the reports.
Sidekiq has a notion of middleware (similar to middleware in Rack). Code examples for implementing server middleware, client middleware, and an “exporter” class that actually updates the registry are somewhat lengthy, but if you’re curious, you can find them in this gist.
Now for the fun part. In Prometheus’ paradigm, all metrics should be exposed through an HTTP server that Prometheus will call from time to time. So, yes, we need to run a WEBrick from inside of a Sidekiq server. And don’t forget about threads:
Sidekiq.configure_server do |config|
  config.server_middleware do |chain|
    chain.add SidekiqMetricsServerMiddleware
  end

  # Start server to expose metrics for Prometheus collector
  Thread.new do
    Rack::Handler::WEBrick.run(
      Rack::Builder.new do
        use Rack::CommonLogger, ::Sidekiq.logger
        use SidekiqExporter, registry: Prometheus::Client.registry
        run ->(_env) { [404, { "Content-Type" => "text/plain" }, ["Not Found\n"]] }
      end,
      Host: ENV["PROMETHEUS_EXPORTER_BIND"] || "0.0.0.0",
      Port: ENV.fetch("PROMETHEUS_EXPORTER_PORT", 9394),
      AccessLog: []
    )
  end
end
Bingo! Now we can go to /metrics endpoint at localhost:9394 and see Sidekiq reporting diligently. In this example, we have used one of the standard Prometheus ports, but you are free to set your own through an environment variable.

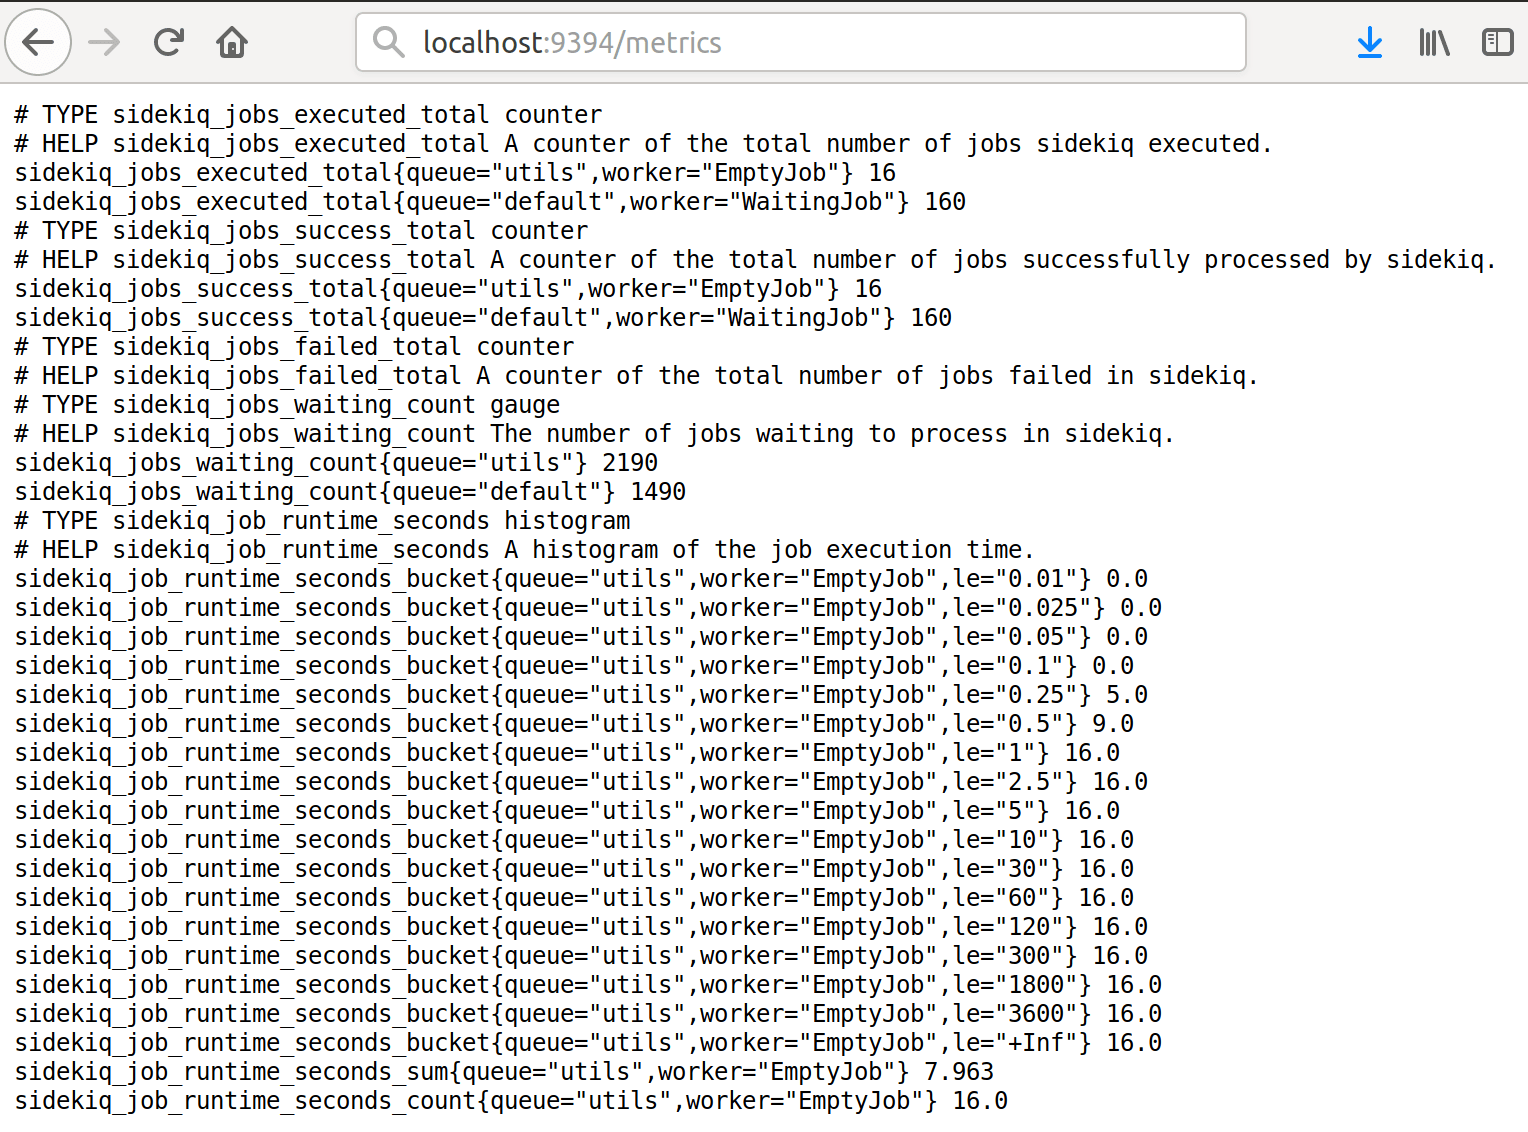
Sidekiq process reports collected metrics in Prometheus’ raw text format
There’s a gem for that. Or four!
”Nice! But should I write all the code above each time?”, you might ask, and the answer is “Not anymore!” Just add these gems to your Gemfile:
# Gemfile

gem 'yabeda-sidekiq'
# required for Prometheus export
gem 'yabeda-prometheus'
With Yabeda, all code from the chapter above is reduced to three lines inside the Sidekiq’s initializer:
# config/initializers/sidekiq.rb

Sidekiq.configure_server do |_config|
  Yabeda::Prometheus::Exporter.start_metrics_server!
end
This will declare, collect, and serve at /metrics endpoint all ten built-in metrics that we mentioned above. Port number can be configured through PROMETHEUS_EXPORTER_PORT or PORT environment variables (default is 9310).
Now it is finally the time to draw the curtain from Yabeda repository.
At the time of this introduction, it holds four gems:
- yabeda-sidekiq. Tracks a set of useful Sidekiq metrics and inserts Sidekiq middleware to collect them.
- yabeda-prometheus. Exports all collected metrics to Prometheus.
- yabeda-rails. Automagically registers and tracks basic Rails application metrics (maybe you don’t need to pay for that monitoring solution, after all).
- yabeda. The base gem that provides a unified DSL for defining metrics and a common API for all adapters, present, and future.
We’ve already seen yabeda-sidekiq, so let’s take a closer look at other members of the family.
yabeda-prometheus
This gem is the one that takes care of exporting collected metrics to Prometheus. We’ve seen it working together with yabeda-sidekiq, but you can use it separately—to export any other metrics you might want to collect and register with Yabeda (through an existing adapter or the one you may be willing to create yourself). Here’s how you can quickly set it up:
# Gemfile
gem "yabeda-prometheus"

# config.ru
# Insert _before_ the main application:
use Yabeda::Prometheus::Exporter
This will add the /metrics endpoint to whatever main web server you are running.
If you need to run a separate server from a long-running non-web process (a complex delayed job, for instance), you can call Yabeda::Prometheus::Exporter.start_metrics_server!
Another option is to use Prometheus’ push gateway, in case you want to report a metric from a short process quickly: Yabeda::Prometheus.push_gateway.add(Yabeda::Prometheus.registry).
Now all the metrics that are known to the base gem through adapters (Rails, Sidekiq, more to come) will be exported to Prometheus automatically. Note that you can plug multiple adapters at the same time to monitor different parts of your application.
yabeda-rails
Just drop yabeda-rails into your Gemfile and get the following set of Rails core metrics for free:
rails_requests_total(counter). The total number of requests for any controller, action, format and response code.rails_request_duration(histogram). Seconds Rails took to handle requests percontroller#action.rails_view_runtime(histogram). Seconds spent on rendering views. Find overcomplicated views with a single look on the graph.rails_db_runtime(histogram). Time spent on executing database requests. This helps to find actions responsible for heavy database requests.
Coupled with yabeda-prometheus for exporting and Grafana for creating dashboards, this gem provides a good alternative to paid monitoring solutions!

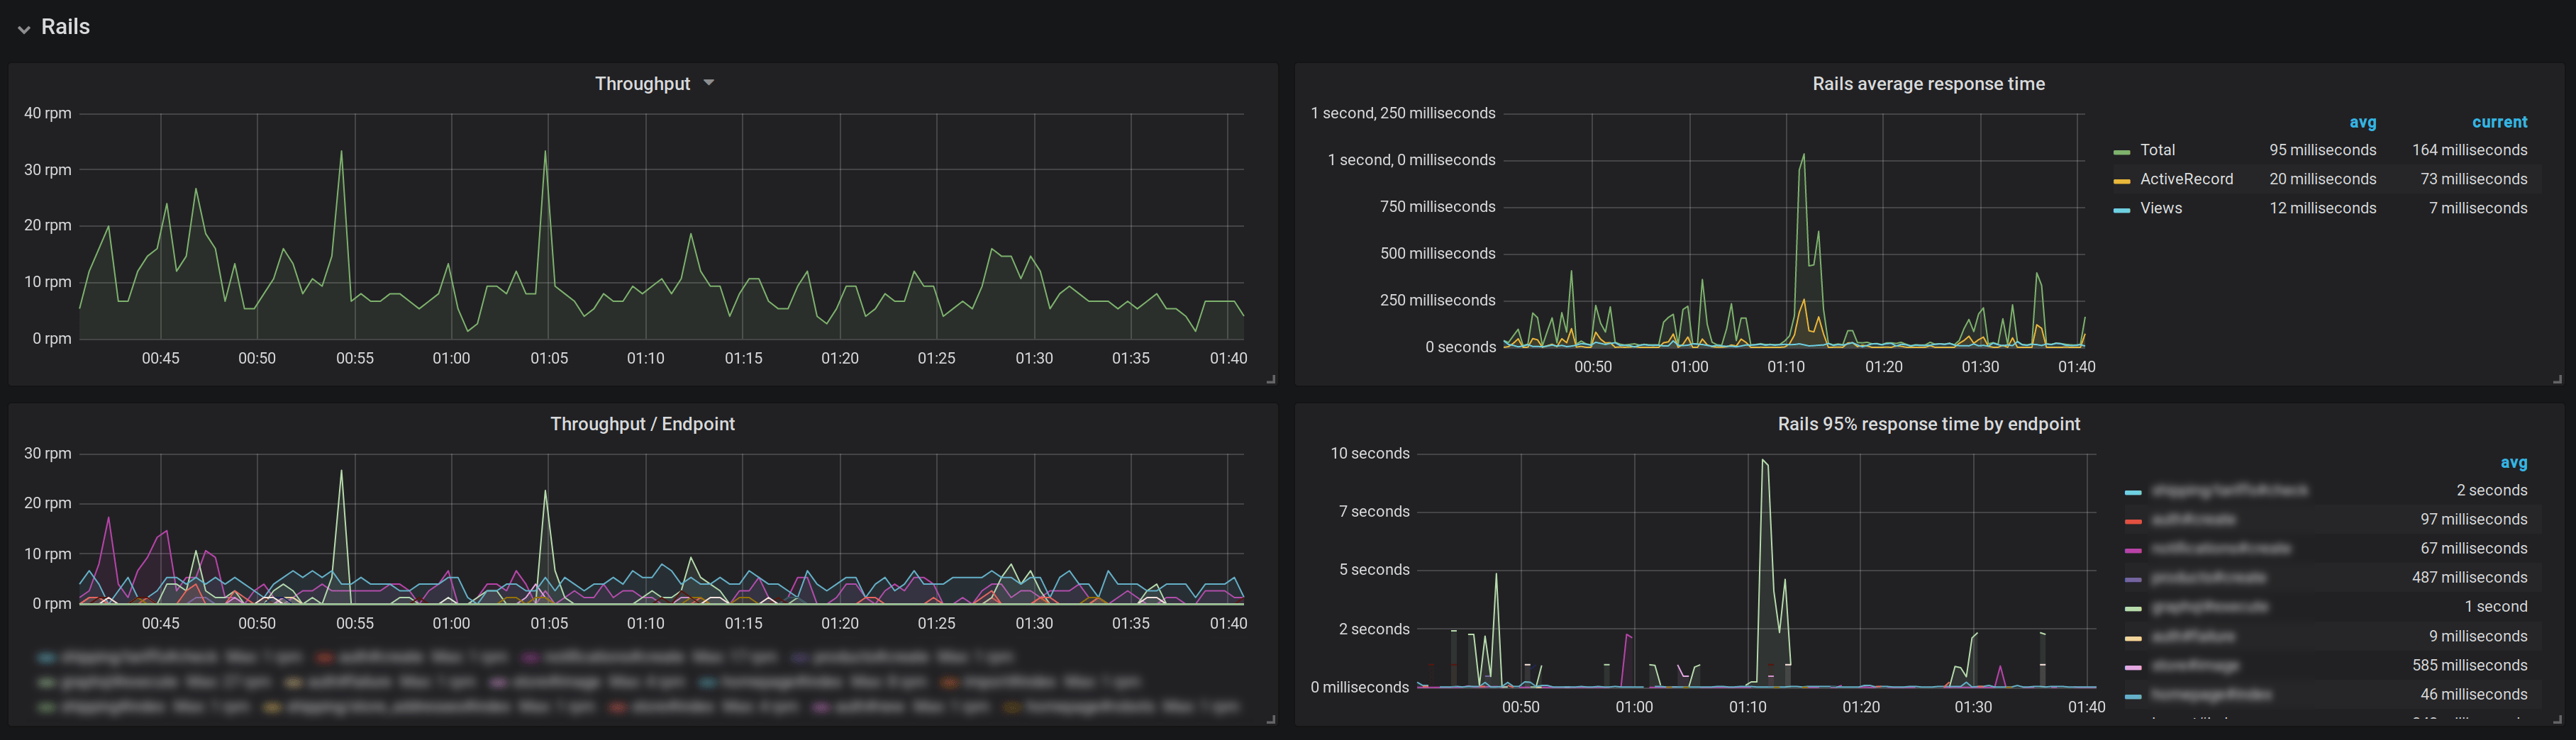
yabeda-rails metrics displayed on a Grafana dashboard. Sorry, we had to blur out some juicy class names!
Useful hooks make it easy to collect custom metrics. Here we are measuring the duration of an external API request by using the after_controller_action hook (you can place it into one of your existing initializers or create a new one).
Yabeda.histogram(:rails_ext_runtime, unit: :seconds, comment: "External APIs request duration")
Yabeda::Rails.after_controller_action do |event, labels|
  rails_ext_runtime.measure(labels, (event.duration / 1000))
end
yabeda
This gem is not supposed to be used directly but provides all the building blocks for creating your own plugin.
In our last article, we have introduced some imaginary metrics for bells and whistles. Here’s how the db_whistles_blows_total can be registered with Yabeda’s DSL:
Yabeda.configure do
  counter :db_whistles_blows_total, comment: 'A counter of whistles blown'
end
That gives you a basic grow-only counter (yes, it sounds fancy, but in fact, it’s just a class that implements an increment public method). You can always access the current value with the name of the metric itself (Yabeda.db_whistles_blows_total) or increment it, attaching labels if necessary:
Yabeda.db_whistles_blows_total.increment(kind: 'success', db_server: 'name_of_db_server_from_config')Lo and behold
Staring at the raw data feed is not fun at all, the whole point for having it is that it can be easily set up as a data source for a visual dashboard, and Grafana is an excellent choice for dashboards. It also plays nice with Prometheus, setting up integration is relatively straightforward.
After a dashboard is up, you can detect production problems at a glance. As they say, there are just three things people can stare at forever: fire, water, and charts.

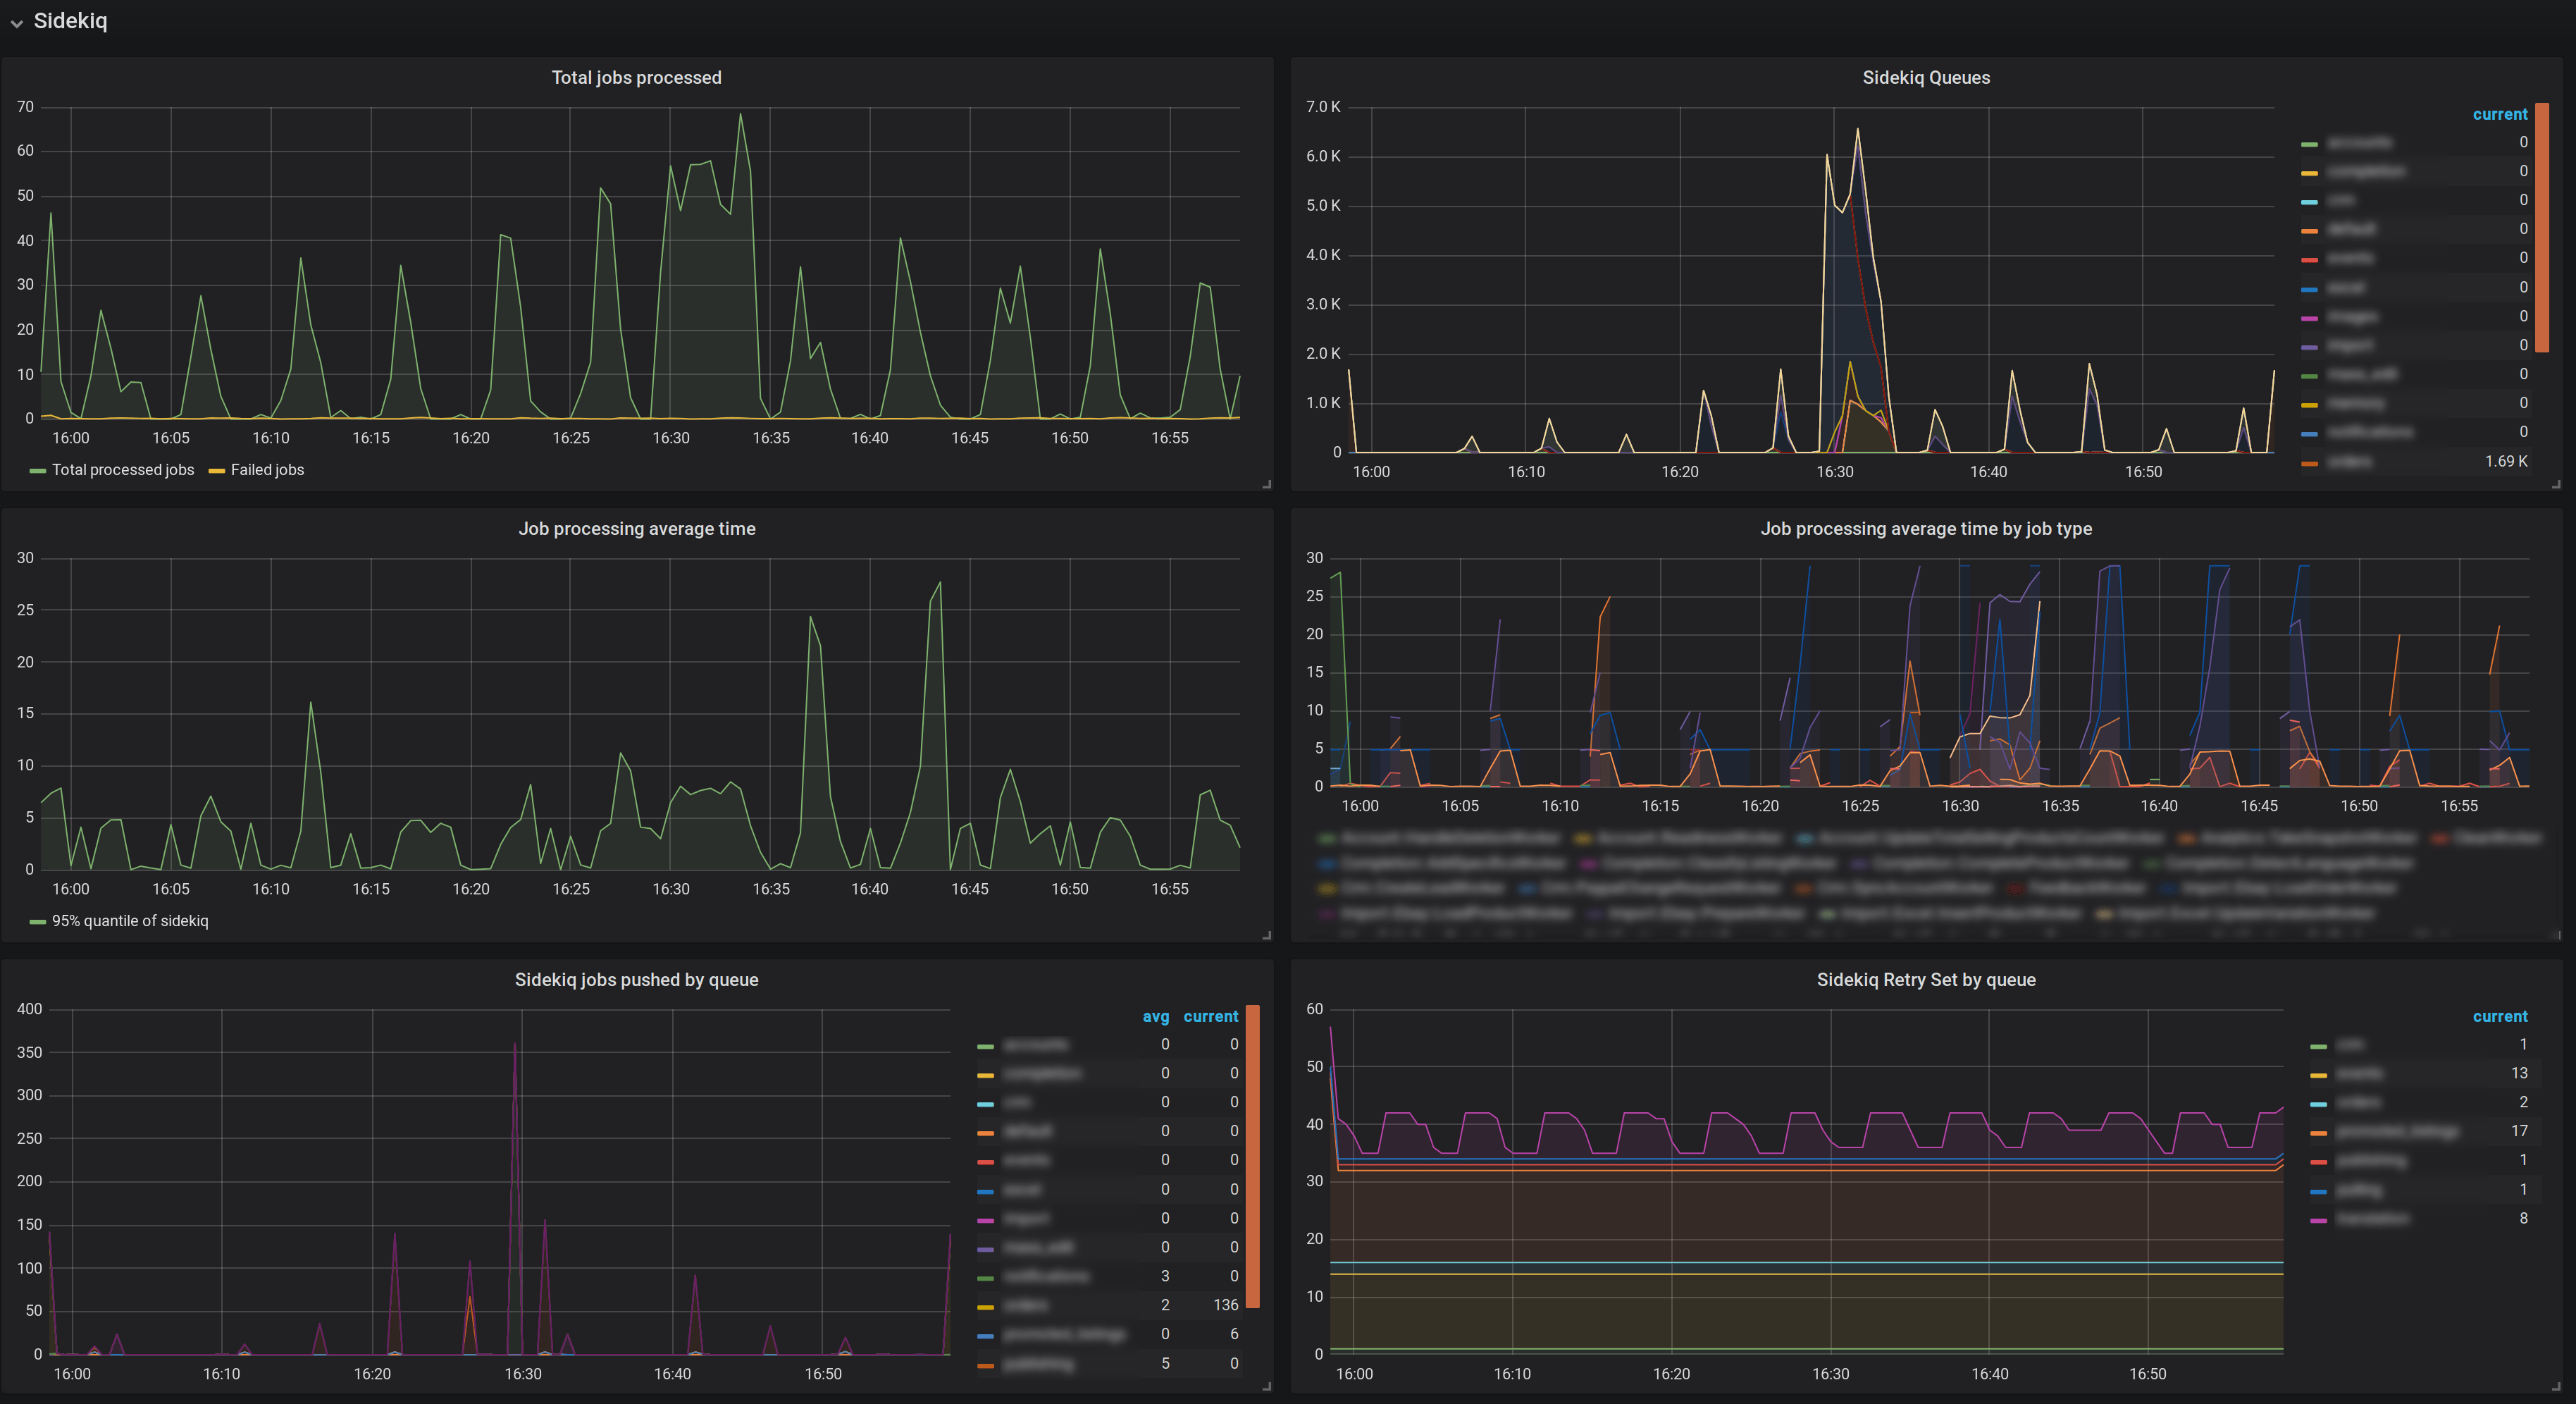
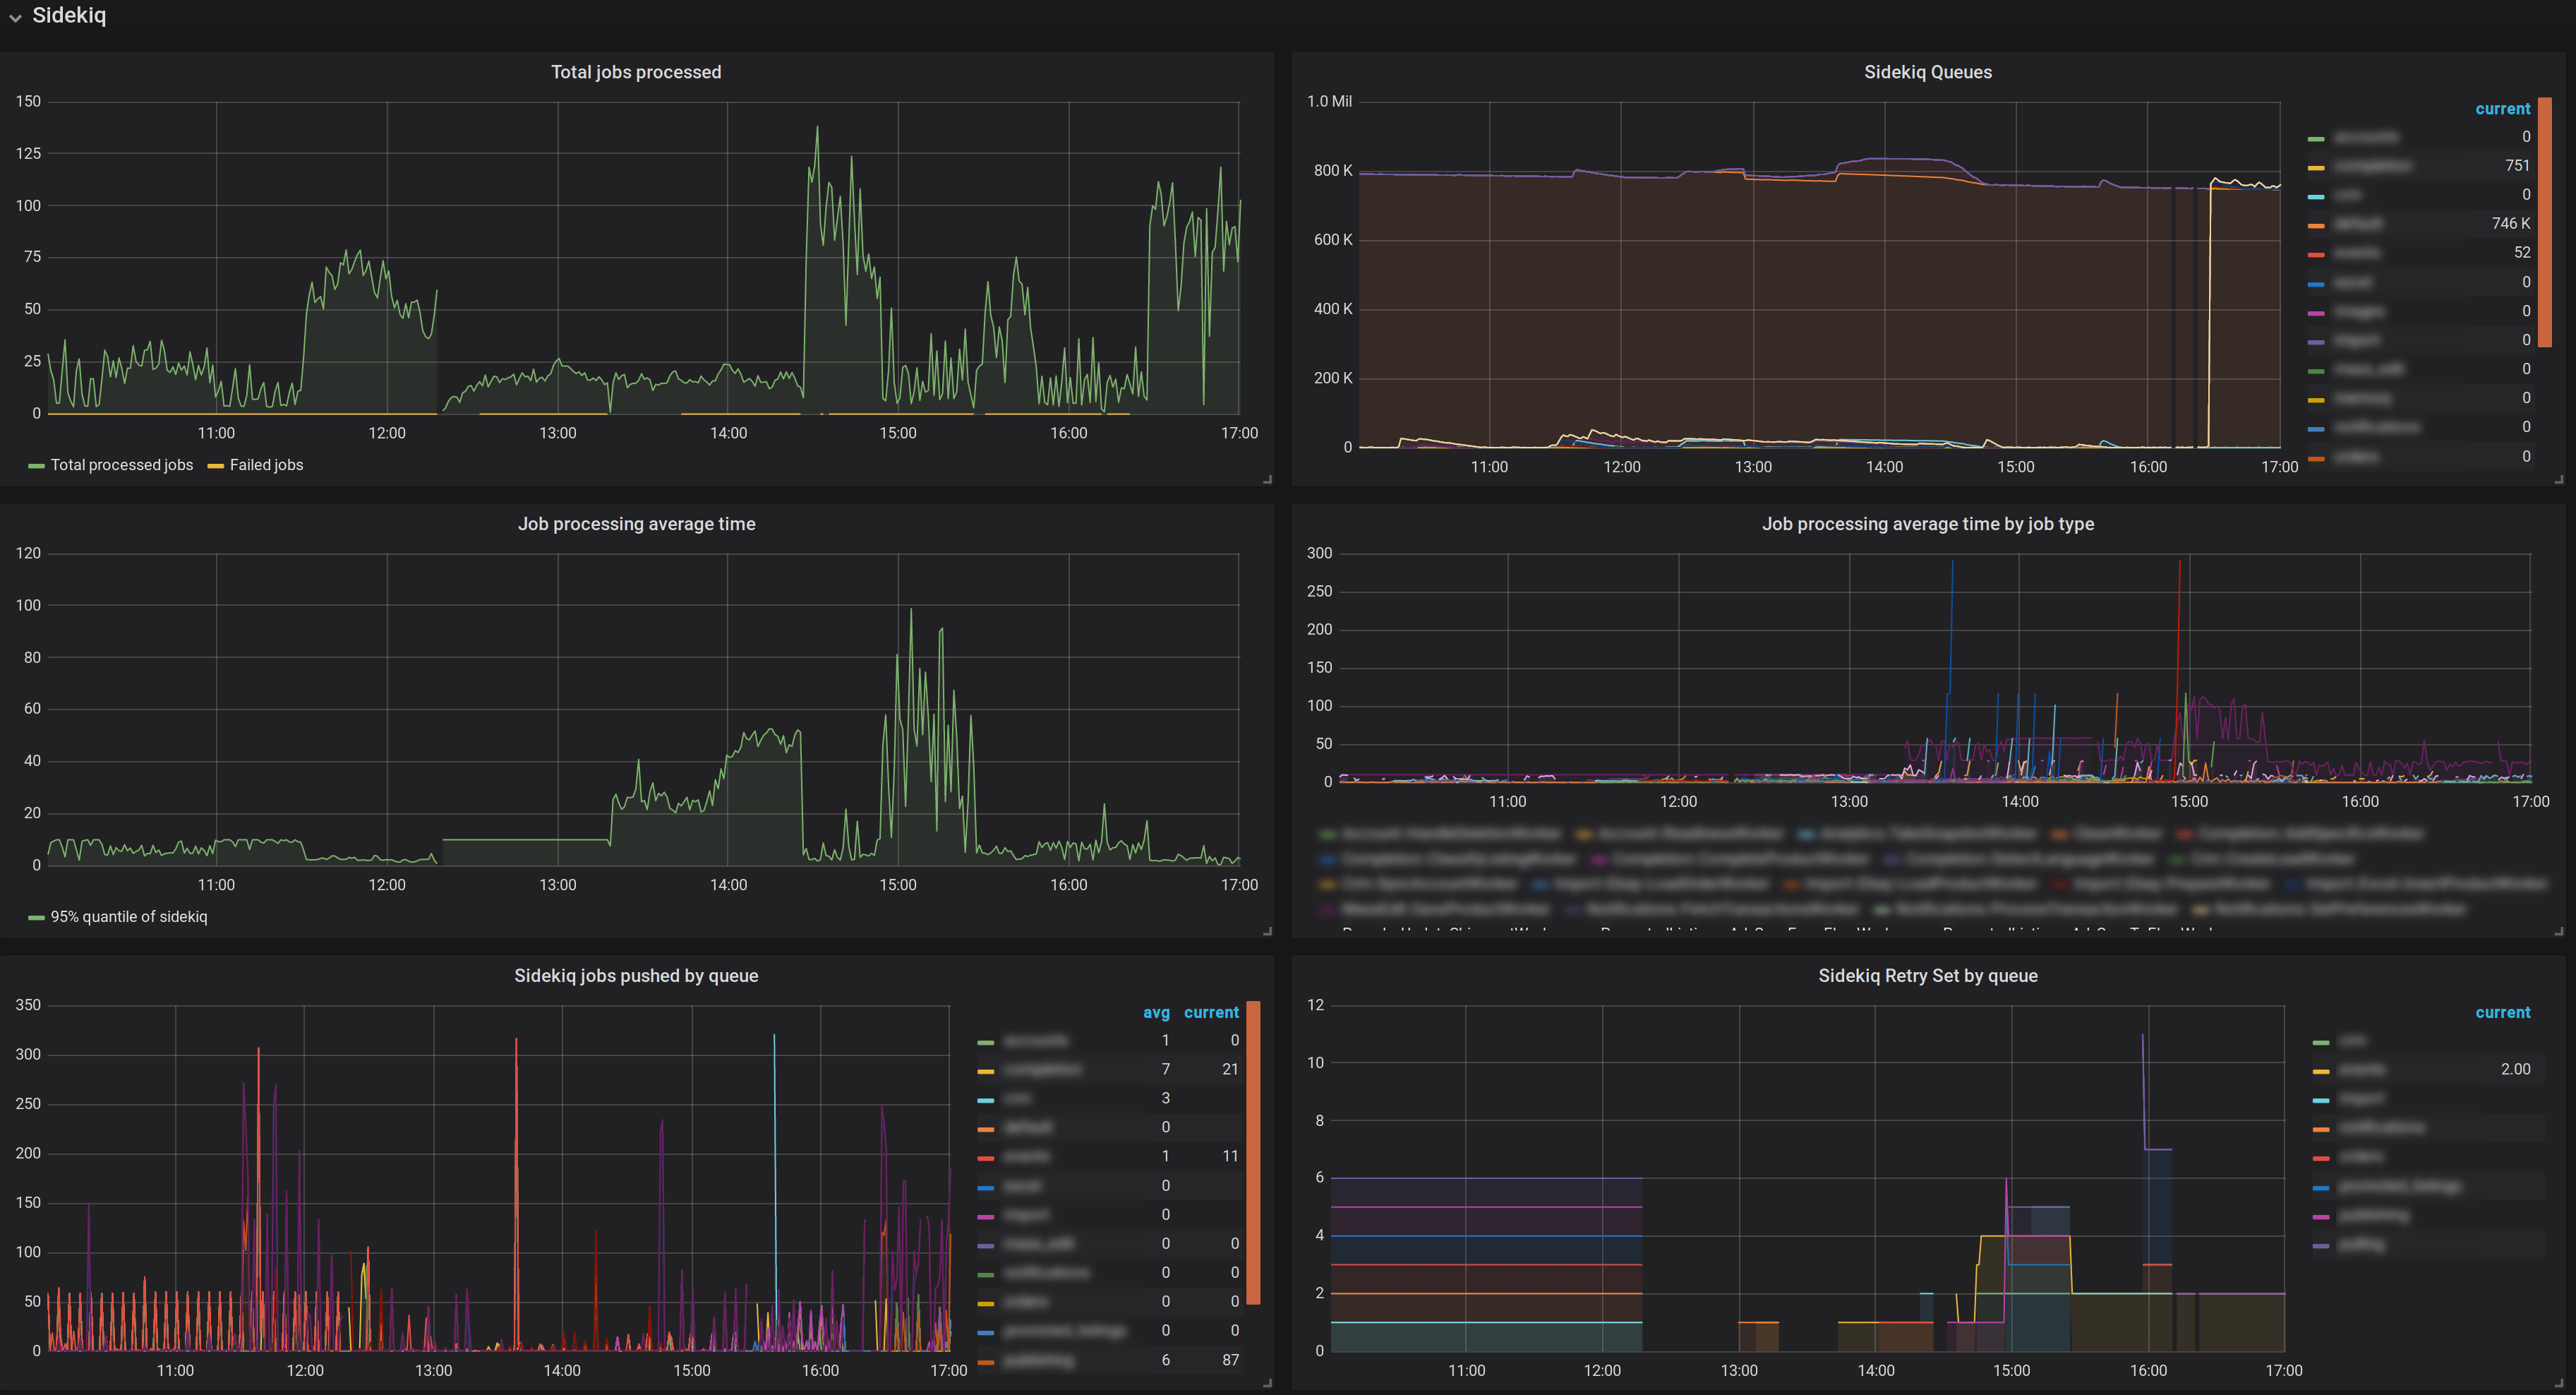
Essential metrics from yabeda-sidekiq displayed on a Grafana dashboard. Sorry, we had to redact names of classes and queues
Above are some metrics collected by yabeda-sidekiq and exported to Prometheus with yabeda-prometheus, represented on a Grafana dashboard. Let’s take a closer look at the size history by queue, and the 95th percentile of job execution times segmented by worker classes:

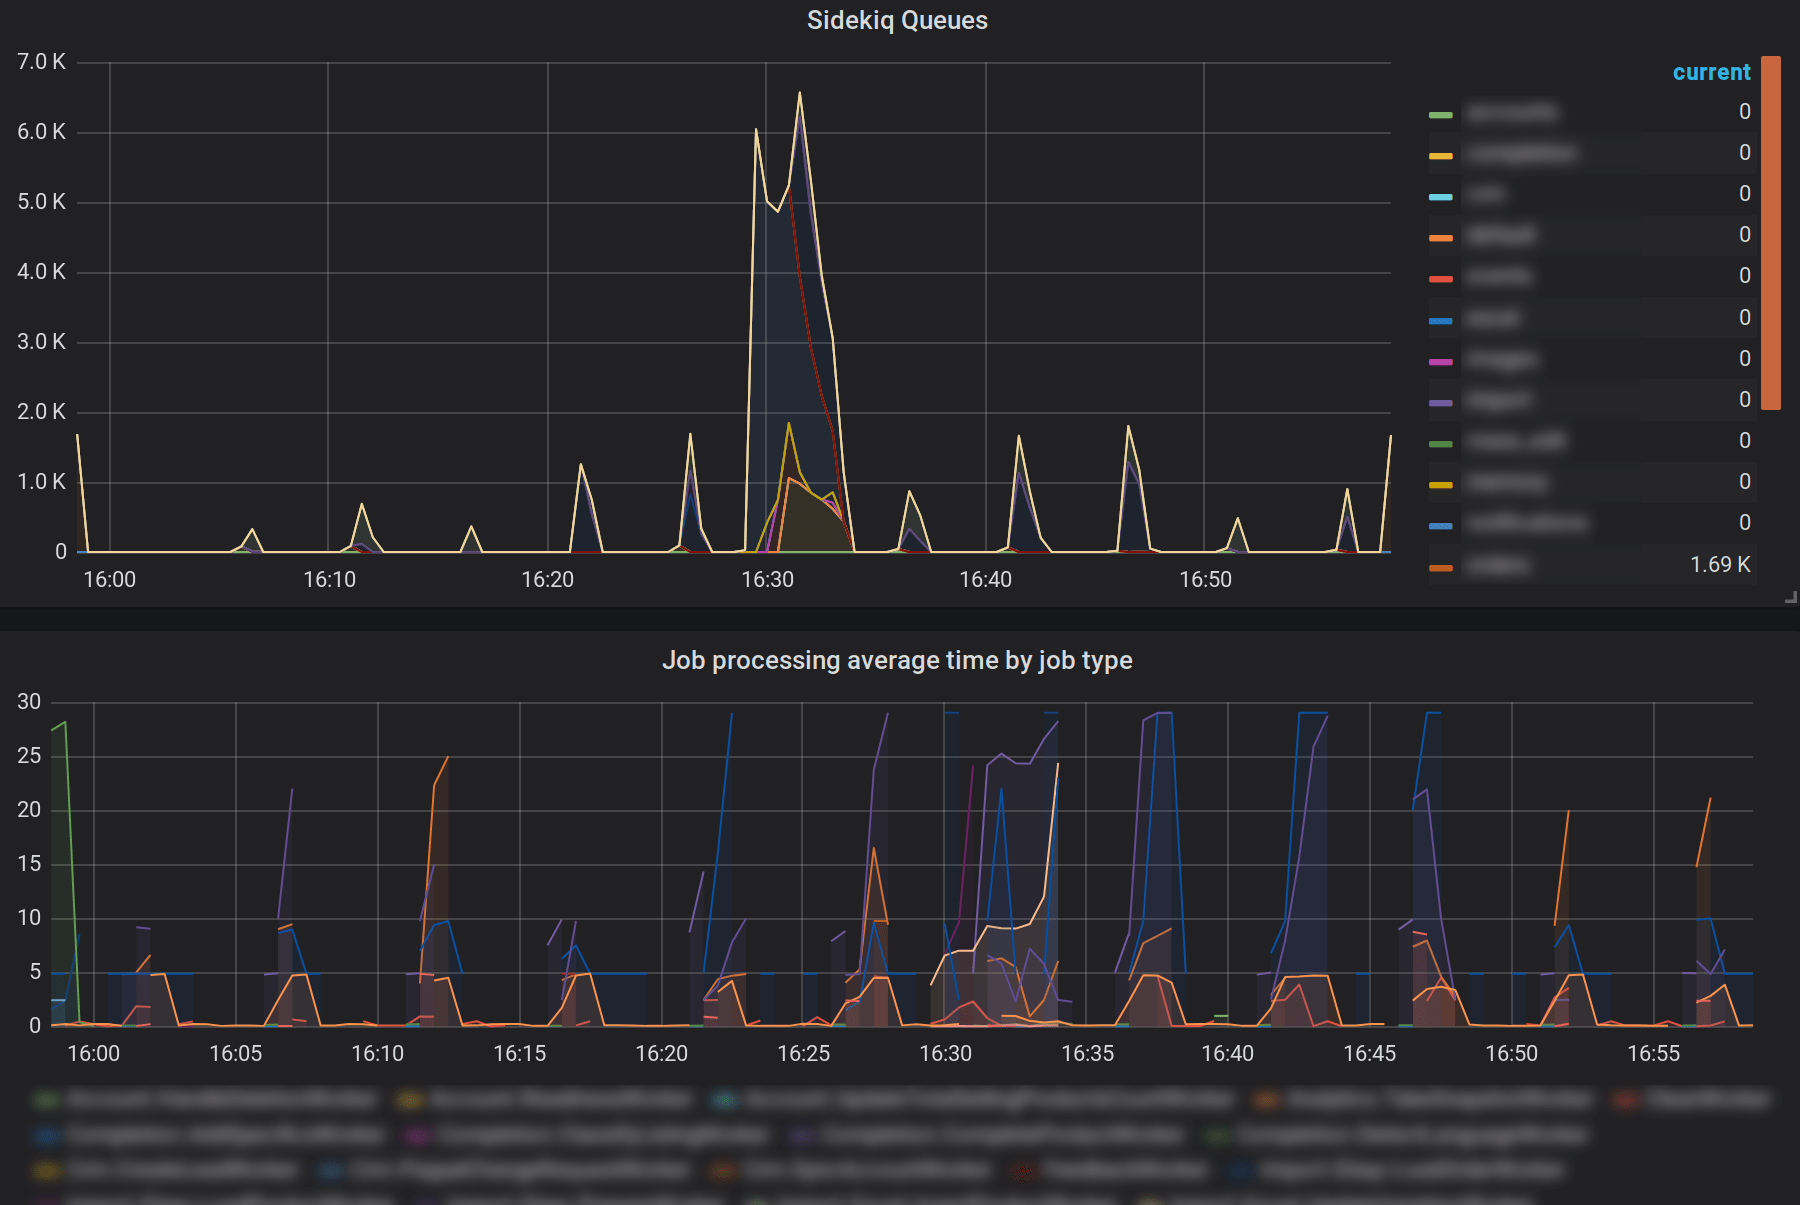
Close-up on Sidekiq queue sizes history and average processing times by job type
The screenshot above shows business as usual: we frequently drain our queues, and that means we have enough capacity.
But if things ever go wrong (and they will, per Murphy’s law), we will notice it immediately:

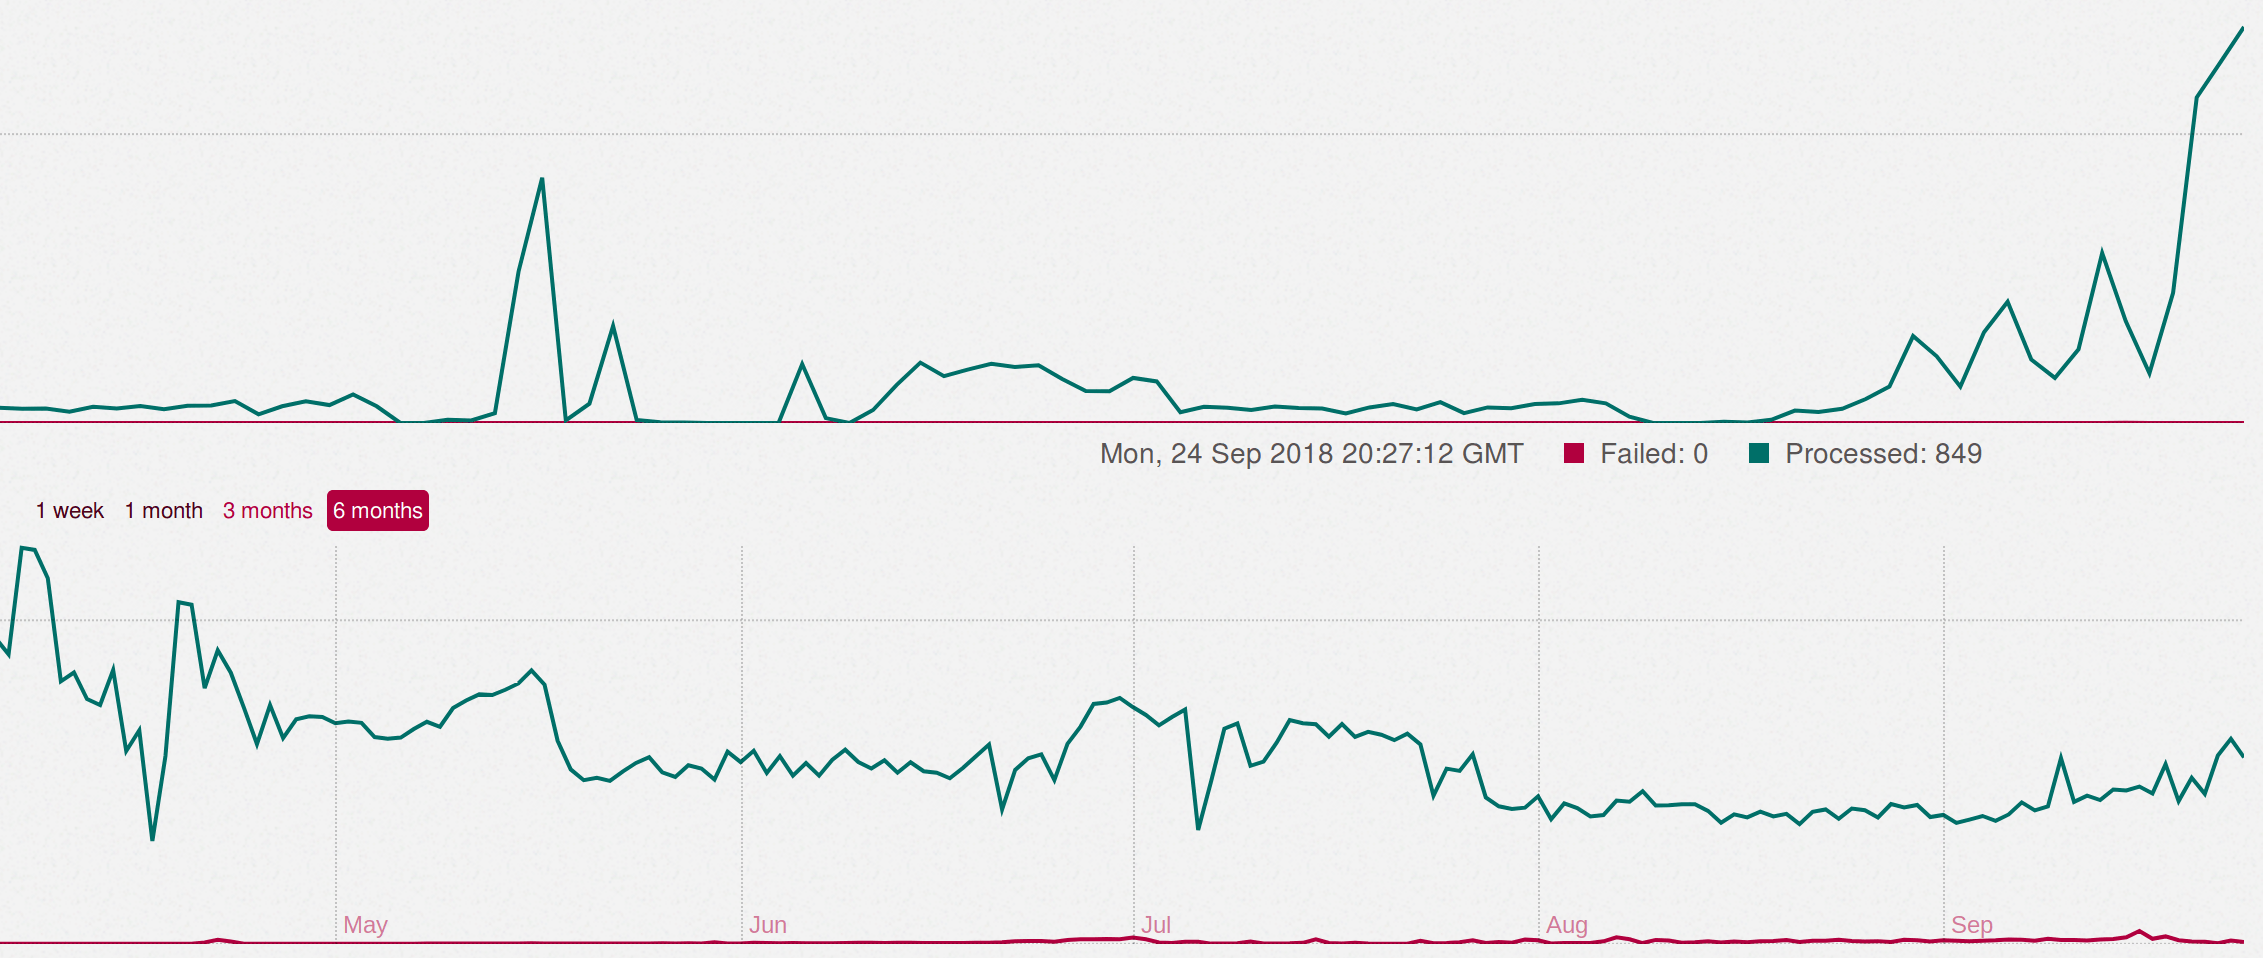
800K tasks in a queue signal a problem
From the picture above we can tell that we won’t be able to drain our queues even after a few days (as queue size decreased just slightly in the past 7 hours):

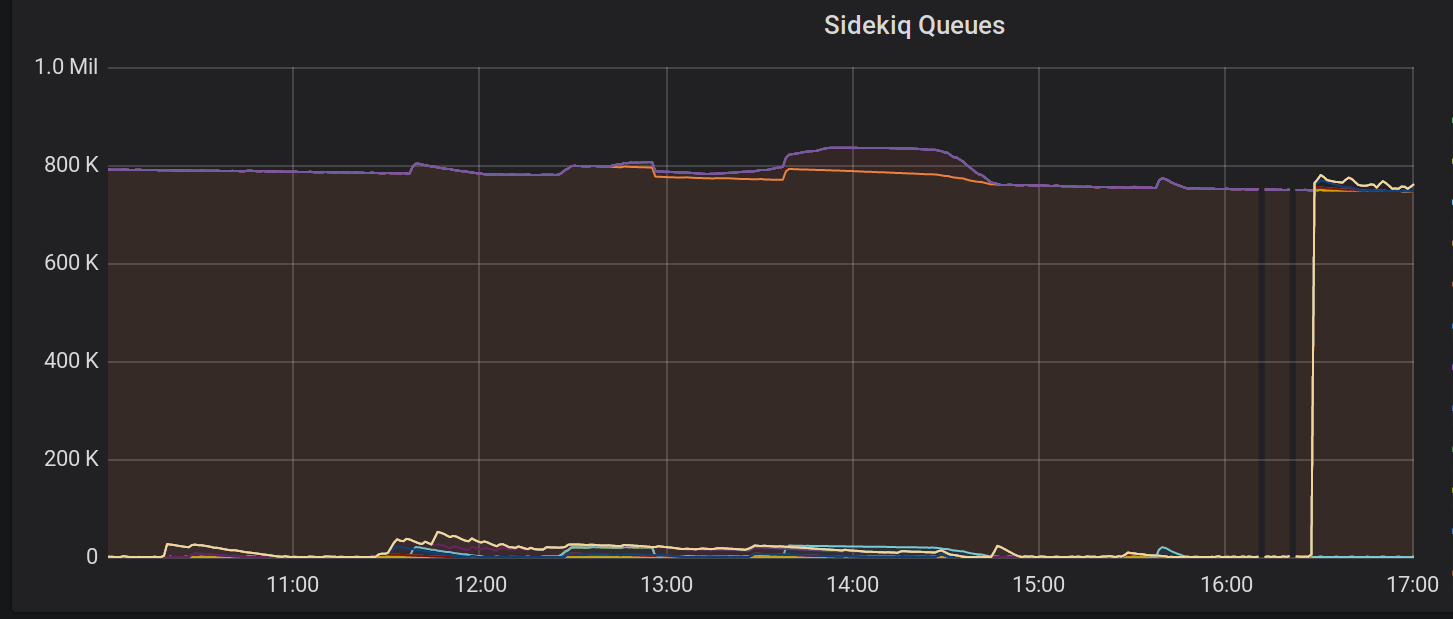
A close-up of the problem: queues are not being drained in time
And our 95th percentile job processing time has increased to one minute (up to several minutes for some worker classes). Panic mode on.
Now it’s time to try scaling the amount of Sidekiq workers:

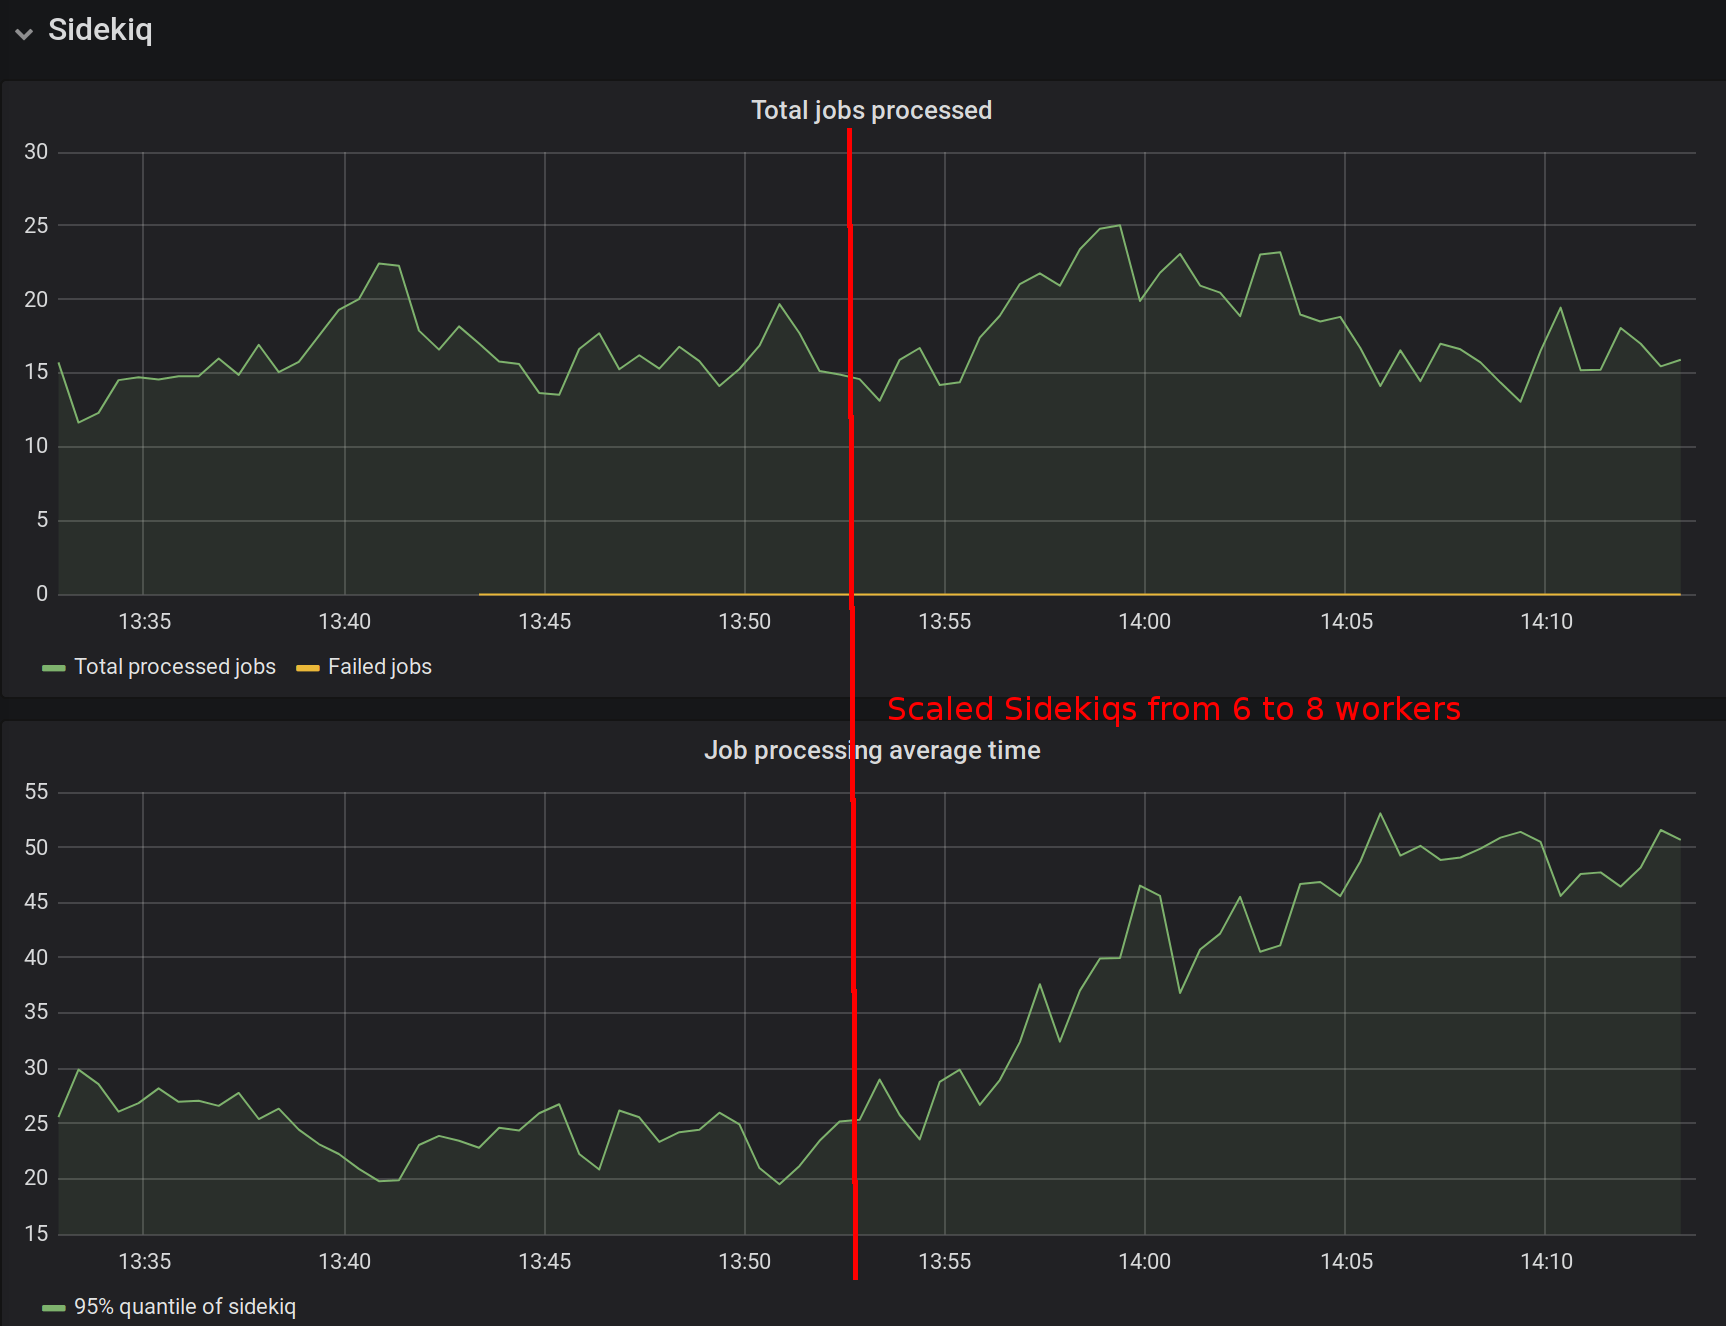
It seems that scaling made matters worse…
As we see on the screenshot above, scaling did not seem to help: job processing speeds actually went up after we added more workers.
However, we have enough data to investigate further, and we soon find out that the true reason behind the crisis is a single user who has amassed most of the jobs and it causes deadlocks on the database level.
Now that is a problem we can start solving!
Join the effort
We’ve been working on Yabeda for the past year, extracting solutions from the production code and putting them into a modular, extendable, open source framework. While the proof of concept is definitely reached, the API can still be refined, and your input would be invaluable. We do not recommend using Yabeda in production right away, but if you have a greenfield project that allows experiments—we would definitely like to know how smooth was the integration and what features, in your opinion, are still lacking. Feel free to open an issue in any repo listed under our organization.
The documentation is also very minimal at the moment: definitely enough for the first look, but we are willing to put more work on making it as accessible and beginner-friendly as possible. Hopefully, with your help.
For a quick jump-start introduction to Yabeda concepts, we recommend trying out a demo Rails application that comes in a Docker container: nothing beats reading the code and running an application.

We believe that a free, all-inclusive, one-stop solution for instrumenting and monitoring Ruby applications was long overdue and we cannot wait for the reaction from Ruby and Rails communities. Stars, issues, and PRs are welcome!