Product-market fit methodology for early-stage devtool companies


Everyone talks about product-market fit. But what does it actually mean for a developer tools startup? “Are we close?” “Getting closer?” “What should we focus on to get closer?” At Evil Martians, we’ve spent nearly 20 years working with devtools companies—from pre-seed through Series B and beyond—and we kept hearing these same questions. So we built a scoring model that actually answers them, grounded in data from 37 real companies, and put it right on our homepage.
The Sean Ellis problem
The standard way to measure PMF is Sean Ellis’s “very disappointed” survey: ask your users how they’d feel if they could no longer use your product, and if 40%+ say “very disappointed,” you have PMF.
Two problems. First, nobody shares their results, so you can’t set benchmarks. You have no idea whether 40% is great for devtools or just the table stakes. Second, it’s self-reported and subjective. A user who says they’d be “very disappointed” might churn next month; a user who shrugs might be deeply embedded in your product.
After years of advising devtools startups, we wanted something grounded in observable metrics—numbers you can track, compare, and act on.
The idea
We set out to build a PMF scoring model specifically for devtools. The approach: look at product signal metrics from real companies at different stages, find benchmarks that actually apply to developer tools, and from all that data build a formula that scores where your company sits on the PMF spectrum. The result is the PMF Compass, and it’s live on Evil Martians’ homepage.
Try the PMF Compass → Then come back to understand how to read the results.
PMF is not a Boolean, it’s a spectrum. You don’t wake up one morning with PMF. You move through levels: from first users → first revenue → repeatable growth → category leadership. Our compass maps seven distinct levels.
Product signal and revenue signal are separate—and the gap between them is informative. A company with strong product love but weak revenue has a go-to-market problem, not a product problem. A company with revenue outpacing product metrics is standing on a shaky foundation. Separating the two scores tells you where to focus.
Your weakest product metrics tell you where to look first. If retention is strong but conversion is weak, that’s a pricing or packaging problem—not a reason to rebuild the product. Sometimes you should double down on your strengths instead, but knowing where the gaps are is the starting point.
Devtools are not generic SaaS
When we compared our devtools data to general SaaS benchmarks (OpenView 2023, the last edition before they shut down), the differences were striking:

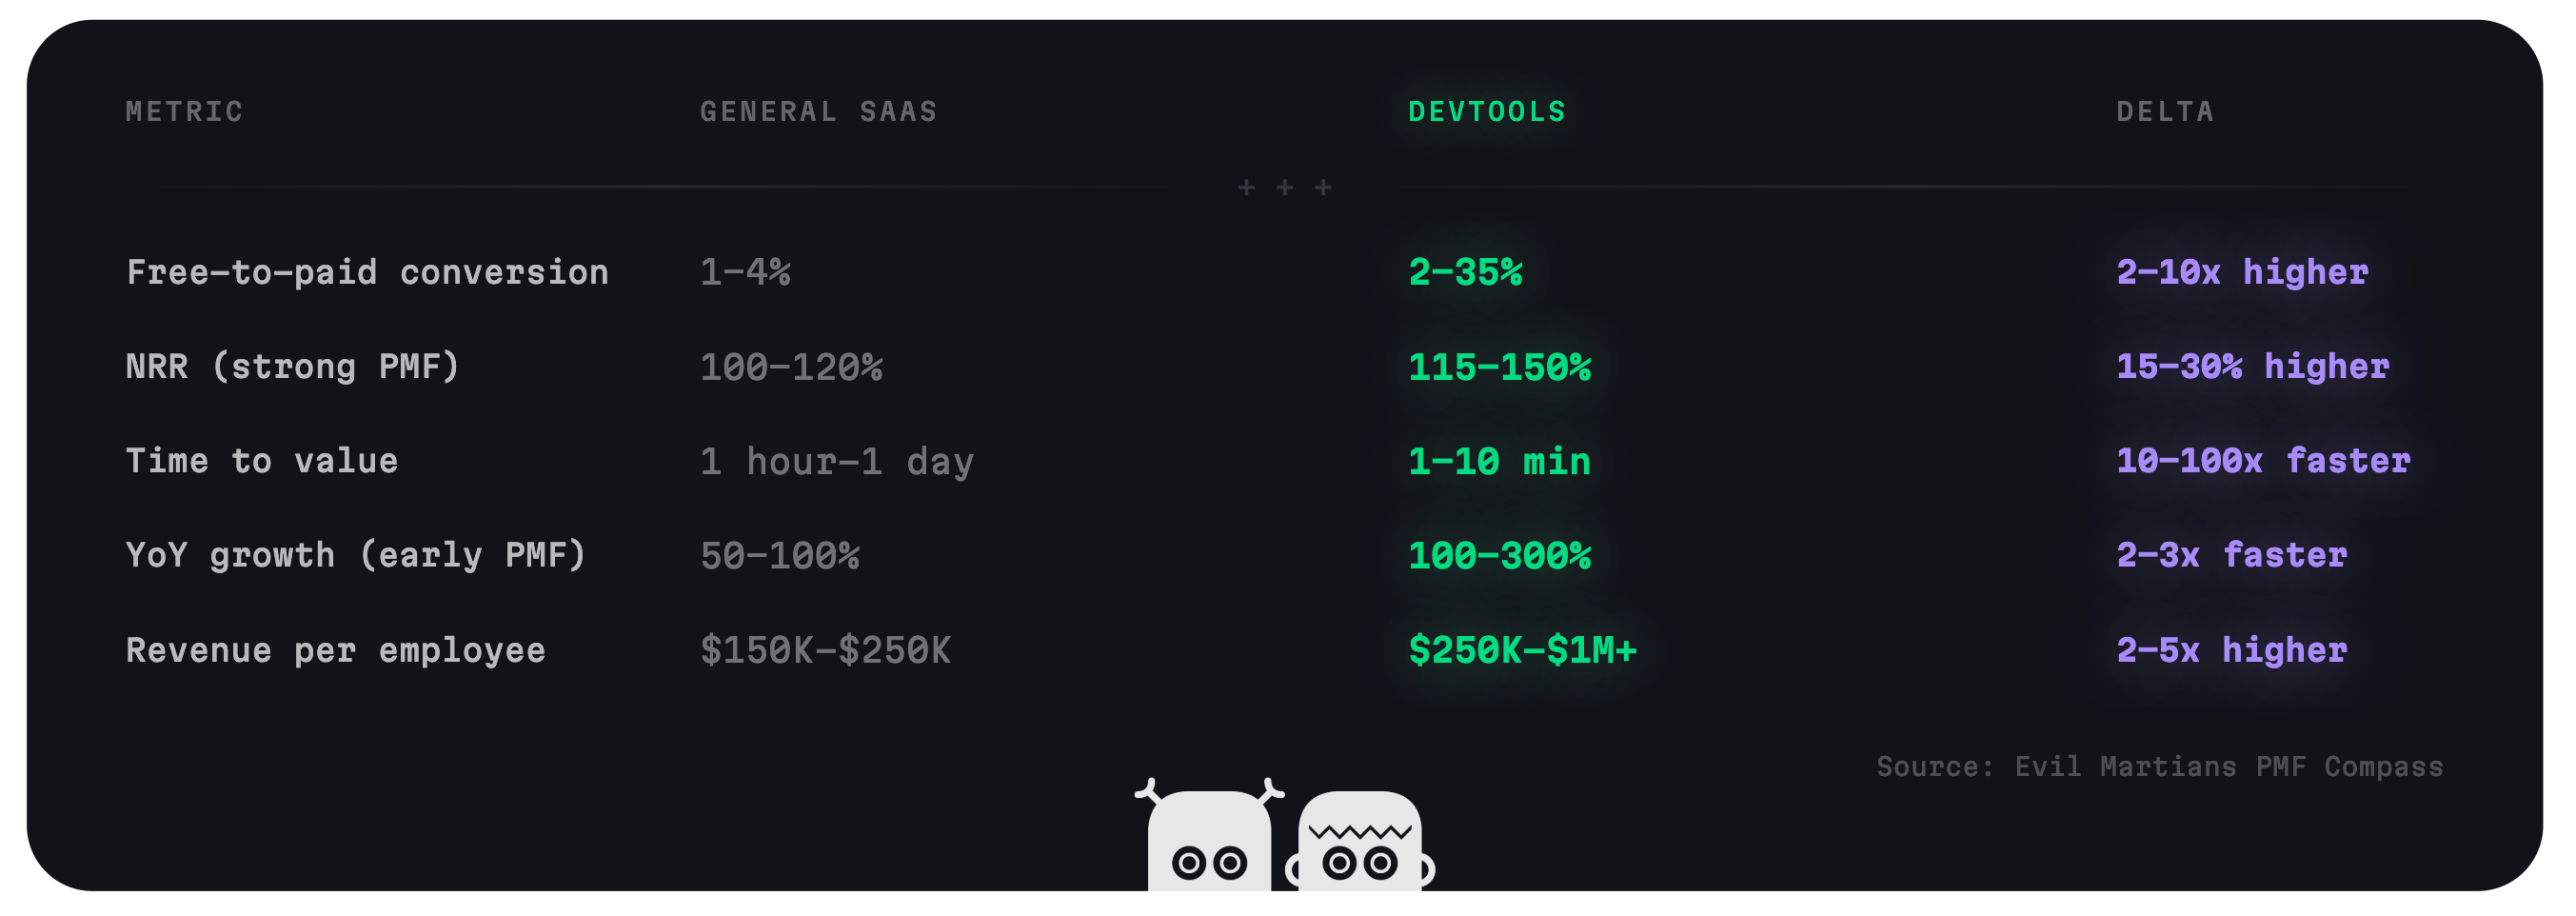
Devtools benchmarks vs. general SaaS (OpenView 2023): conversion, NRR, time to value, YoY growth, and revenue per employee
Why the difference?
Higher conversion — when a devtool solves a real workflow problem, the value is concrete and measurable. Developers can justify the spend because they can point to time saved.
Higher net revenue retention (NRR) — devtools have natural seat expansion (individual to team to org) and usage-based pricing that grows with success.
Faster time to value — self-serve is existential, not nice-to-have. If you can’t deliver value in 5 minutes, developers leave.
Faster growth — the AI wave is unprecedented. Cursor, Replit, and Bolt.new are all showing 1,000%+ growth.
The dataset
Evil Martians built the compass on data from 37 devtools companies across AI products, developer tools, infrastructure, and cybersecurity:
1Password, Abnormal AI, Bolt.new, Chainguard, CrowdStrike, Cursor, Daytona, Datadog, Figma, Framer, GitLab, Grafana, HashiCorp, LaunchDarkly, Linear, LiveKit, Lovable, Netlify, Neon, PlanetScale, PostHog, Railway, Render, Replit, Resend, Sentry, Snyk, StackBlitz, Stripe, Supabase, Tailscale, Temporal, Twilio, Typesense, Vercel, Wiz, WorkOS.
Data sources include S-1 filings (for public companies), Sacra and Contrary Research reports, and founder interviews on Dev Propulsion Labs, Developer-led Podcast, Lenny’s Podcast, and Lex Fridman Podcast.
A caveat: this is directional, not precise. Some metrics like day-7 (D7) retention are rarely disclosed publicly, so certain benchmarks rest on thin data. This is our first version of the compass—if it proves useful, we’ll invest in expanding and hardening the dataset.
The dual score: signal vs. revenue
Signal quality (0–7) measures how well the product works for the people using it. It’s a weighted composite of five metrics: time to first value (how fast new users get real value), retention (how many return), net revenue retention (whether customers expand over time), free-to-paid conversion (how many find enough value to pay), and organic signups (how many arrive without acquisition spend).
Revenue stage (0–7) measures where you are on the monetization curve. It maps directly to your annual recurring revenue (ARR): from Building ($0) through Alpha, Beta, Traction, and Early PMF, all the way to Leader ($200M+). There is no weighting or composite going on here—just where the money says you are.
How the signal score is calculated
Each metric is scored against the benchmark tables below, then combined as a weighted average. Three primary signals carry equal weight, and two secondary signals carry equal but lower weight:
Primary signals (weight 3 each):
- Time to first value — in devtools, slow onboarding kills adoption before retention even gets a chance.
- Retention — if users don’t come back, nothing else matters.
- Net revenue retention — expansion revenue separates tools that grow inside accounts from tools that plateau.
Secondary signals (weight 2 each):
- Free-to-paid conversion — proves the product delivers enough value that users will pay.
- Organic signups — a trailing indicator. Strong product drives organic growth, not the other way around.
The weighted average maps to a 0–7 signal level. The revenue stage is simpler: it’s a direct lookup from your current ARR.

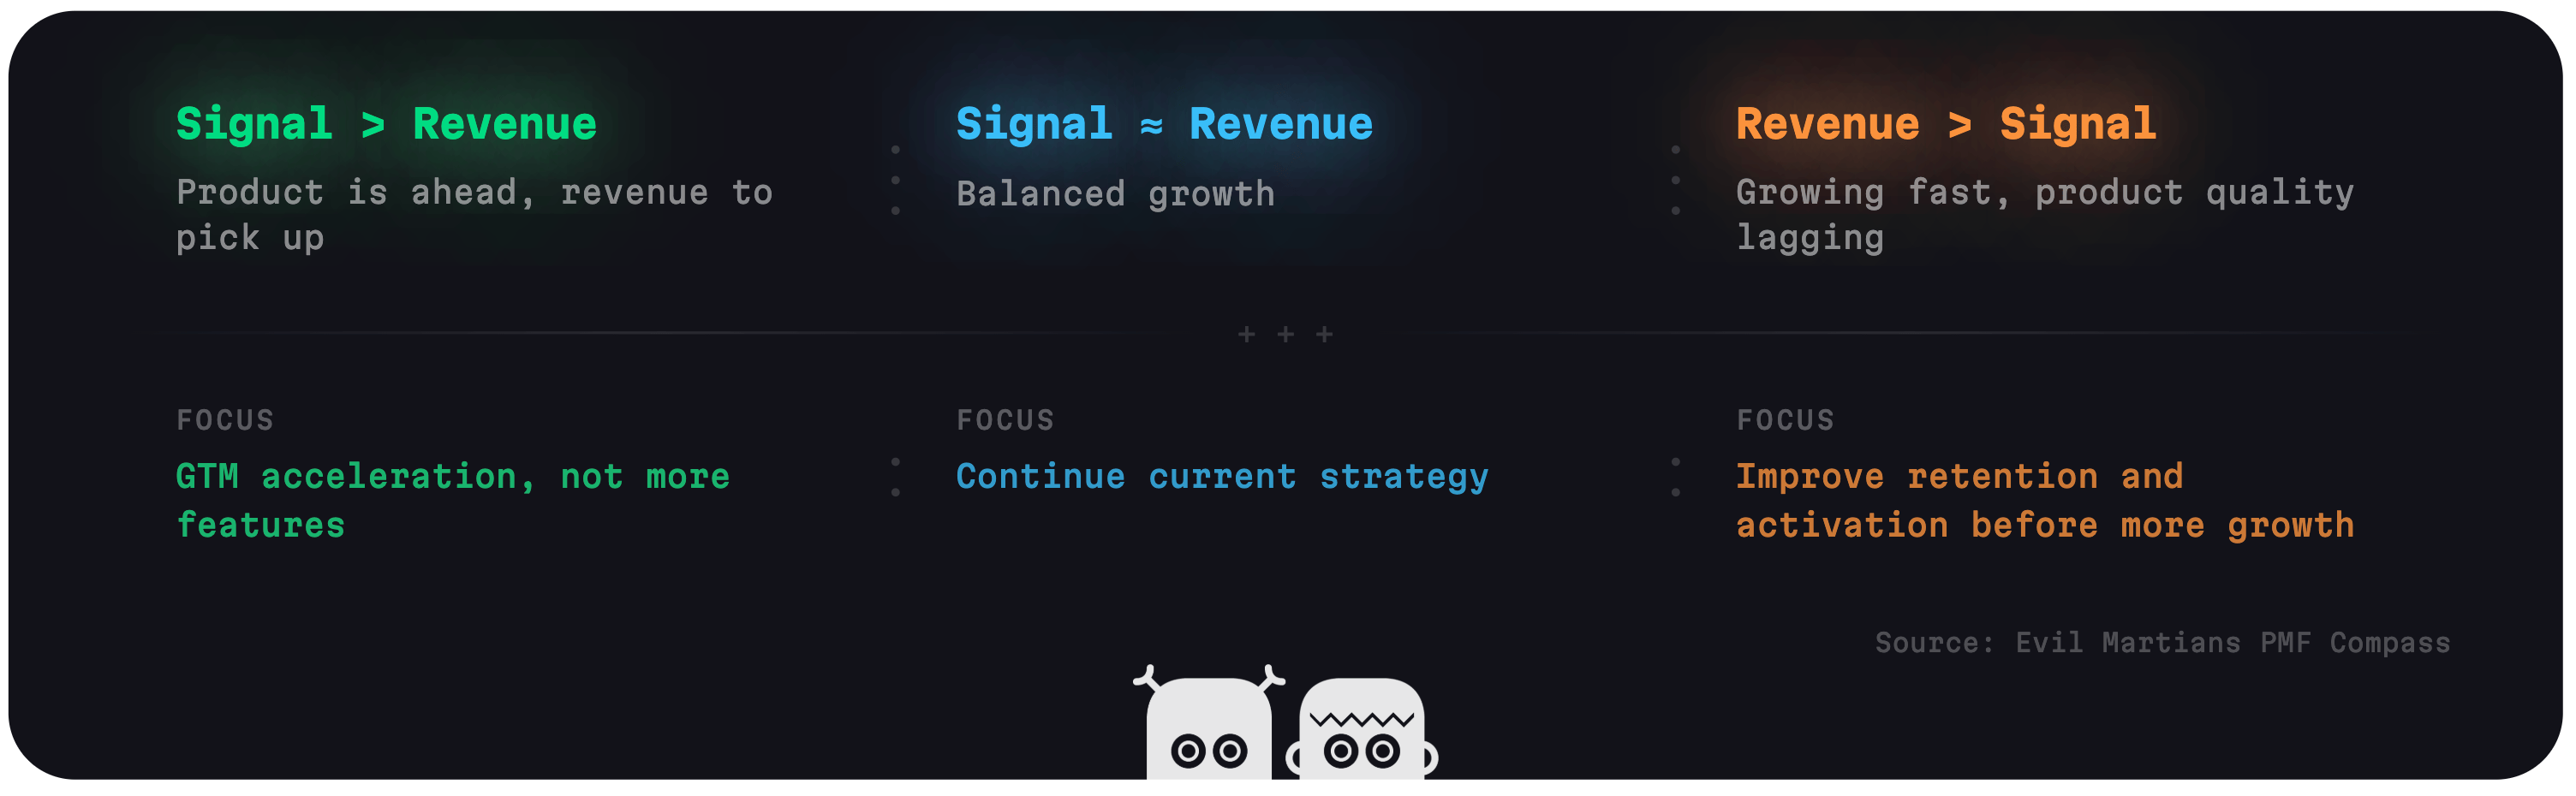
The gap between signal quality and revenue stage tells you where to focus
Bottom line? If your signal score is higher than your revenue score, you have a strong product that hasn’t yet found its monetization stride—focus on go-to-market acceleration, not more features. If revenue is ahead of signal, you’re growing fast but the foundation may be shaky—focus on retention and activation before pouring more into growth.
Where are your PMF levels?
The PMF Compass maps your company to a PMF level from 0 to 7. Each level has a different priority—the metric that matters most shifts as you grow.

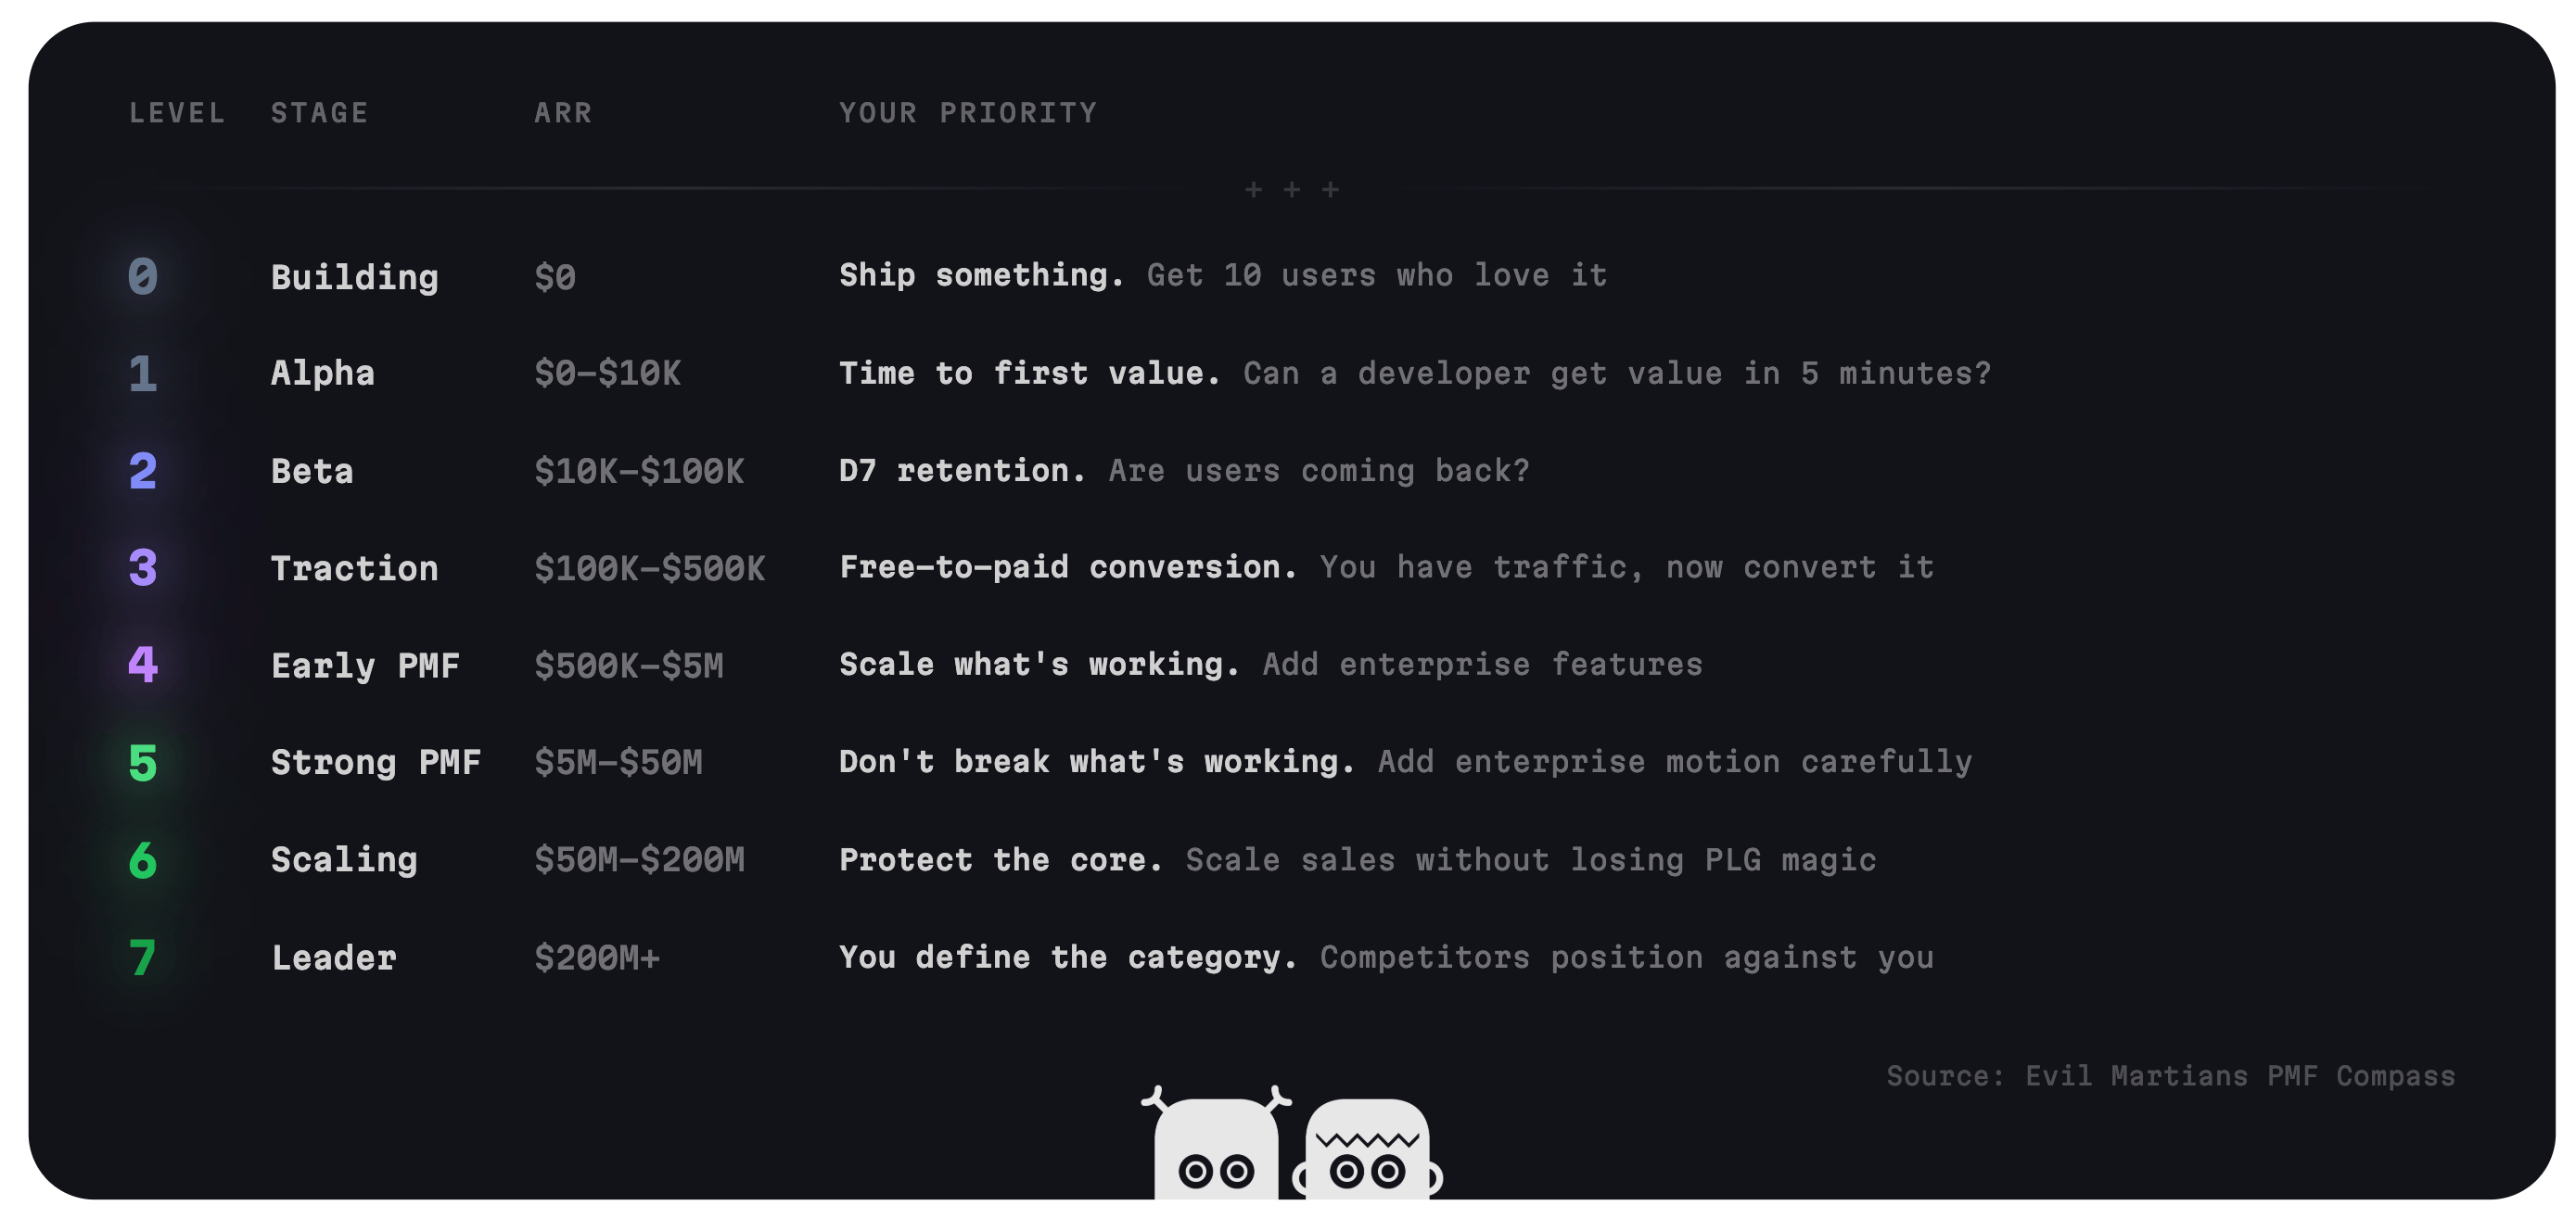
PMF levels 0–7: from Building ($0) to Leader ($200M+), with the priority metric at each level
Level 2: Beta ($10K–$100K ARR)
You have dozens of paying customers and you’re starting to see retention patterns. Some are churning, some are expanding—now you need to figure out which is which and why.
Resend was here in 2023 with ~$50K ARR and 80K developers using their email API. Typesense was self-funded at a similar stage, finding first customers for their search engine. Daytona had $300K ARR but deliberately sacrificed it to pivot toward better product-market fit—a gutsy move that only makes sense when you’re watching retention closely.
Focus: D7 retention. Are users coming back after first signup?
Level 3: Traction ($100K–$500K ARR)
Clear retention, organic growth starting, repeatable acquisition. The difference from level 2: organic signups are real—over 30% of signups come from word-of-mouth.
Chainguard was at ~$200K ARR in early 2024 with 640% year-over-year growth ahead. WorkOS was around $300K ARR in 2021 with $20K average revenue per customer, leaning into enterprise from the start. Framer was at ~$400K, finding product-market fit in website building.
Focus: Free-to-paid conversion. You have traffic—now convert it.
Level 4: Early PMF ($500K–$5M ARR)
NRR is above 100%—revenue grows inside accounts without you pushing. This is the stage where things either accelerate or stall.
Cursor was at $4M ARR in April 2024 with 250% NRR and 35% free-to-paid conversion—about to explode. Resend hit $5M ARR in 2024 with 80K developers and a 22-person team, raising their Series A. LiveKit was at ~$3M run rate with 100K+ developers when they raised their Series A—strong signal, early revenue.
Focus: Scale what’s working. Add enterprise features like SSO and audit logs.
Beyond level 4
At level 5 ($5M–$50M), you’re a known name—developers recommend you unprompted. Tailscale hit $45M ARR with 1M+ monthly active users and 20K paid business customers.
At level 6 ($50M–$200M), you’re the default choice in your category. Supabase reached $70M ARR with 250% year-over-year growth and 4.5M+ users. Linear reached $100M ARR with 145% NRR and 2,000% enterprise growth. Sentry hit $128M with 4M developers across 90K organizations.
At level 7 ($200M+), you define the category. Median time to $100M ARR is 8+ years. Best-in-class before the AI wave was 5–6 years. Cursor did it in 12 months with zero marketing spend—the fastest ever.

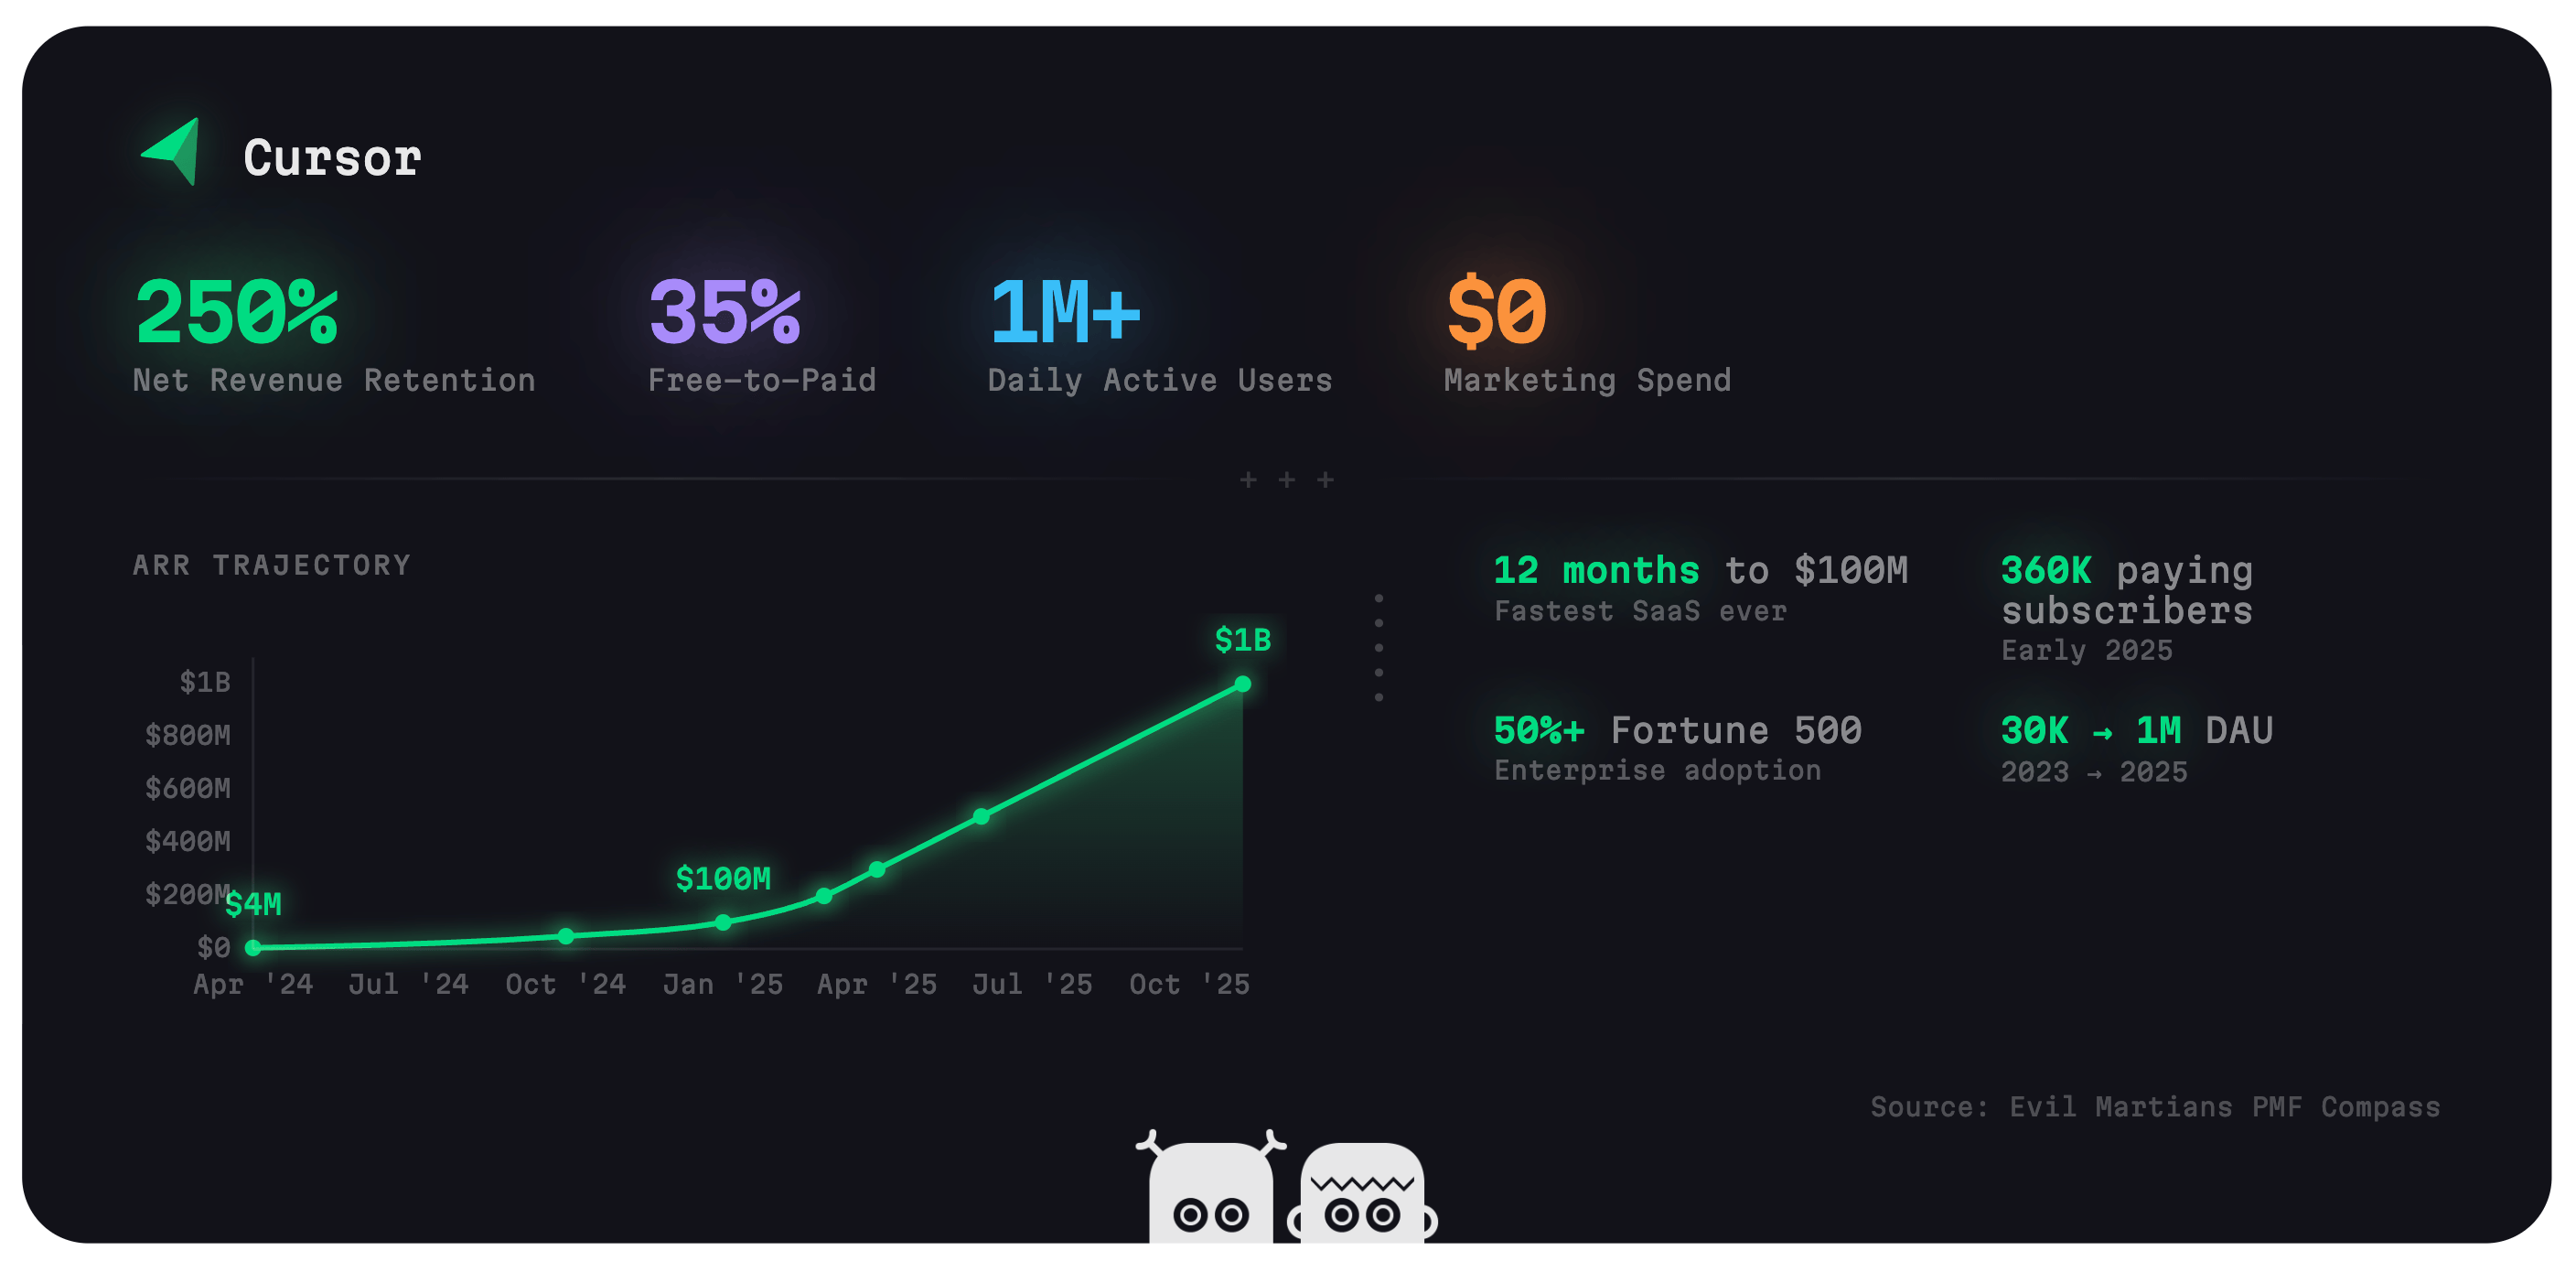
Cursor’s ARR trajectory: $4M (Apr 2024) → $100M (Jan 2025) → $1B (Nov 2025)
Key product signals
Time to first value
This is how quickly a new user gets real value from your product. AI has redefined “exceptional” from under 10 minutes to under 1 minute. Benchmarks differ by category:
| Category | Exceptional | Strong | On track | Needs work |
|---|---|---|---|---|
| Tooling | <5 min | 5–15 min | 15–30 min | >30 min |
| Infrastructure | <4 hours | 4 hrs–1 day | 1–3 days | >3 days |
| Cybersecurity | <1 hour | 1–4 hours | 4–24 hours | >1 day |
Cursor nailed instant TTFV by making the “Tab” feature predict your next edit, not just the next token—it works the moment you open a file with zero setup. Michael Truell’s insight: the IDE is the right place to integrate AI because it has full context (codebase, cursor position, edits, errors). That architectural decision is why TTFV is literally instant.
Bolt.new generates a full-stack app in 20–60 seconds. The secret is WebContainers—Node.js running in the browser via WebAssembly. StackBlitz—an Evil Martians client—spent years building this deep infrastructure (2019–2023) before AI made it explosively valuable. The browser boots an OS in 100–200ms, so there’s nothing to install, no environment to configure.
Supabase gives you a running PostgreSQL database in minutes with one click. Their multi-product approach (DB + auth + storage + realtime) means you get value from multiple features at once in your very first session.
Wiz scans an entire cloud environment in under 15 minutes—no agents to install, no code changes. They went agentless and graph-based from day one (“the world is a graph, not a table”), which meant instant deployment into any cloud account. That architectural bet made their TTFV 10x faster than competitors requiring agent installation.
Retention
How many users come back after signing up. The right metric depends on your go-to-market motion: product-led growth (PLG) companies should track D7 retention of all signups (not just activated users), while enterprise companies track annual logo retention.
| GTM | Metric | Exceptional | Strong | On track | Needs work |
|---|---|---|---|---|---|
| PLG | D7 retention | >35% | 25–35% | 15–25% | <15% |
| Enterprise | Annual logo retention | >95% | 90–95% | 80–90% | <80% |
Lovable reports 85% day-30 retention—better than ChatGPT. When users build something in 30 seconds and it works, they come back the next day to build more.
Abnormal AI holds 99% annual renewal rates across 3,000 enterprise customers. Their approach: behavioral AI that learns what “normal” email patterns look like per organization, so it catches threats that rule-based systems miss. Once trained on your data, ripping it out means losing that learned protection—retention is built into the architecture.
CrowdStrike holds 97% gross retention even after their major outage in 2024. A caveat: this is partly switching costs—once endpoint protection is deeply integrated into an organization’s security stack, ripping it out means rebuilding every device, policy, and alert workflow. High retention from lock-in is real but different from high retention from product love. The compass doesn’t distinguish between the two, and arguably it shouldn’t—both contribute to PMF.
1Password maintains over 90% gross retention at scale. The mechanism: individual developers adopt it personally, bring it to their team, then IT standardizes on it company-wide. Each layer of adoption makes it harder to leave.
Net revenue retention
How much your existing customers spend over time, including upgrades and churn. Devtools NRR runs 15–30% higher than general SaaS because of natural seat expansion and usage-based pricing.
| Level | Exceptional | Strong | On track | Needs work |
|---|---|---|---|---|
| NRR | >130% | 110–130% | 100–110% | <100% |
The pricing model drives the range: usage-based companies typically land at 120–140% NRR, while seat-based companies run 105–115%.
Cursor posted 250% NRR on their March 2024 cohort—though early-cohort NRR during hypergrowth is inflated by land-and-expand that hasn’t had time to churn. The mechanism is real regardless: free tier (2K completions/month) converts to Pro ($20/month), then Business ($40/seat/month), then Enterprise. Individual developers adopt it, then their team does, then the org buys a site license. Every step is more revenue from the same account.
Linear hits 140–145% NRR on seat-based pricing alone. The expansion path: one team adopts it, then engineering, then product, then design. Pure seat expansion within the same company, no usage-based pricing needed.
Twilio sustained 155–170% NRR at scale with pure usage-based pricing—the more messages and calls your app sends, the more you pay. No upsell conversation needed. Revenue grows automatically as your customers’ apps succeed.
Free-to-paid conversion
The percentage of free users who become paying customers. Top devtools convert at 7%+ vs. the general SaaS median of 2–4%, because developers who find a tool that solves their problem will pay for it.
| Level | Exceptional | Strong | On track | Needs work |
|---|---|---|---|---|
| Conversion | >7% | 3–7% | 1–3% | <1% |
Cursor converts 35% of free users to paid, with 42% trial-to-subscription in 30 days. The free tier gives you 2,000 completions per month—enough to get hooked, not enough for daily work. When Tab predictions become muscle memory, upgrading is obvious.
Datadog converts 22% of product-qualified leads. Their approach: the free tier collects enough data to show the dashboard lighting up. When a team hits scale and needs alerting and cross-service correlation, the value of paying is self-evident.
Railway converts ~5% of its 2M+ users to paid (100K paying customers). Pure PLG with a $5/month starter tier and usage-based pricing beyond that. The free tier lets developers deploy side projects; conversion happens when they ship production workloads and need reliability guarantees.
Figma converts 2–4% at 13 million monthly active users. Lower percentage, massive scale. At high enough volume, even a low conversion rate builds a near-$1B ARR business.
Organic signups
The share of signups that come through word-of-mouth, docs, GitHub, or community rather than paid acquisition. By strong PMF, 50–70% of your signups should be organic. Paid acquisition is a scale lever, not the engine.
We have first-hand data here: Evil Martians maintains over 100 open source projects with 25 billion+ total downloads. Nanoid alone sees 111 million weekly npm installs—more than React. We’ve watched organic adoption compound over a decade across PostCSS, Lefthook, imgproxy, and dozens more.
| Level | Exceptional | Strong | On track | Needs work |
|---|---|---|---|---|
| Organic share | >70% | 50–70% | 30–50% | <30% |
Bolt.new reached 72% organic signups. 60–70% of its users aren’t even developers—the product is so accessible that word spreads far beyond the dev community into design, product, and marketing teams.
Supabase drives 80% of growth through community, according to co-founder Ant Wilson. Recurring Launch Weeks became an organic growth engine—each one is a coordinated release of features, blog posts, and community events that generates sustained attention without ad spend.
Railway grew to 2M+ users with no sales team through 2023—effectively 100% organic acquisition at that stage. A major boost came when Heroku deprecated their free tier in November 2022 and developers migrated in waves. Timing plus a solid free tier turned a competitor’s decision into an organic growth event.
Tailscale grew to 1M+ monthly active users and 20K paid business customers with no marketing org. Their bottom-up model is inherently organic: individuals use the free tier at home, love it, then bring it to work and advocate for company-wide adoption.
Try the compass
Does your devtool have product-market fit? Here’s the quick read: if users return within a week, convert to paid without sales pressure, and expand their usage over time—and you’re past $500K ARR—you’re at or beyond early PMF. But most devtools startups we work with live in the gap between strong product signal and early revenue. That gap is the most important thing to diagnose, because it tells you whether to invest in product or go-to-market.
The PMF Compass is on Evil Martians’ homepage. You answer a few questions—your devtool’s category, go-to-market motion, current ARR, and whichever metrics you already track—and instantly get back:
- Your dual score — whether you have a product problem, a distribution problem, or both
- Gap diagnosis — whether to invest in product or go-to-market right now
- Metric breakdown — each metric rated against devtools benchmarks, not generic SaaS (if your D7 retention is 20%, generic benchmarks say you’re fine—devtools benchmarks say you have a problem)
- Priorities — your weakest metrics ranked, with specific tactics and real benchmarks from the companies in our research
Evil Martians partners with seed-to-Series B devtools founders, embedding engineers and designers directly to ship on these exact metrics—activation, retention, conversion, and go-to-market strategy—across Ruby on Rails, TypeScript, Go, Python, and Rust stacks. Many of our clients are backed by Y Combinator, and we’ve seen these PMF patterns repeat across cohorts and beyond. If the results surprise you, or the recommendations miss something about your situation, reach out to Evil Martians or to me directly.