The Whop chop: how we cut a Rails test suite and CI time in half


Translations
Evil Martians sliced our client Whop’s entire suite runtime in half. This post walks through profiling to find hidden loggers, taming factory overhead, switching to smarter parallelization, and fixing the flaky tests that surfaced along the way.

Hire Evil Martians
Slow test suites or long CI times? Evil Martians build custom developer tools and backend solutions to speed up Rails projects and boost productivity.
Part I: the profiling detective and the smoking gun
Before you can fix a slow test suite, you have to understand where the time is actually going. Guessing is a waste of time, and profiling is essential. Our primary tools for this investigation were TestProf and the powerful StackProf sampling profiler, which TestProf integrates with seamlessly.
Investigation
To get our first look inside the test run, we executed a single command to profile a random sample of 200 tests:
TEST_STACK_PROF=1 SAMPLE=200 bundle exec rspec specSampling is crucial here; trying to profile a full suite that’s made up of thousands of tests would produce a mountain of data so large it would be meaningless.
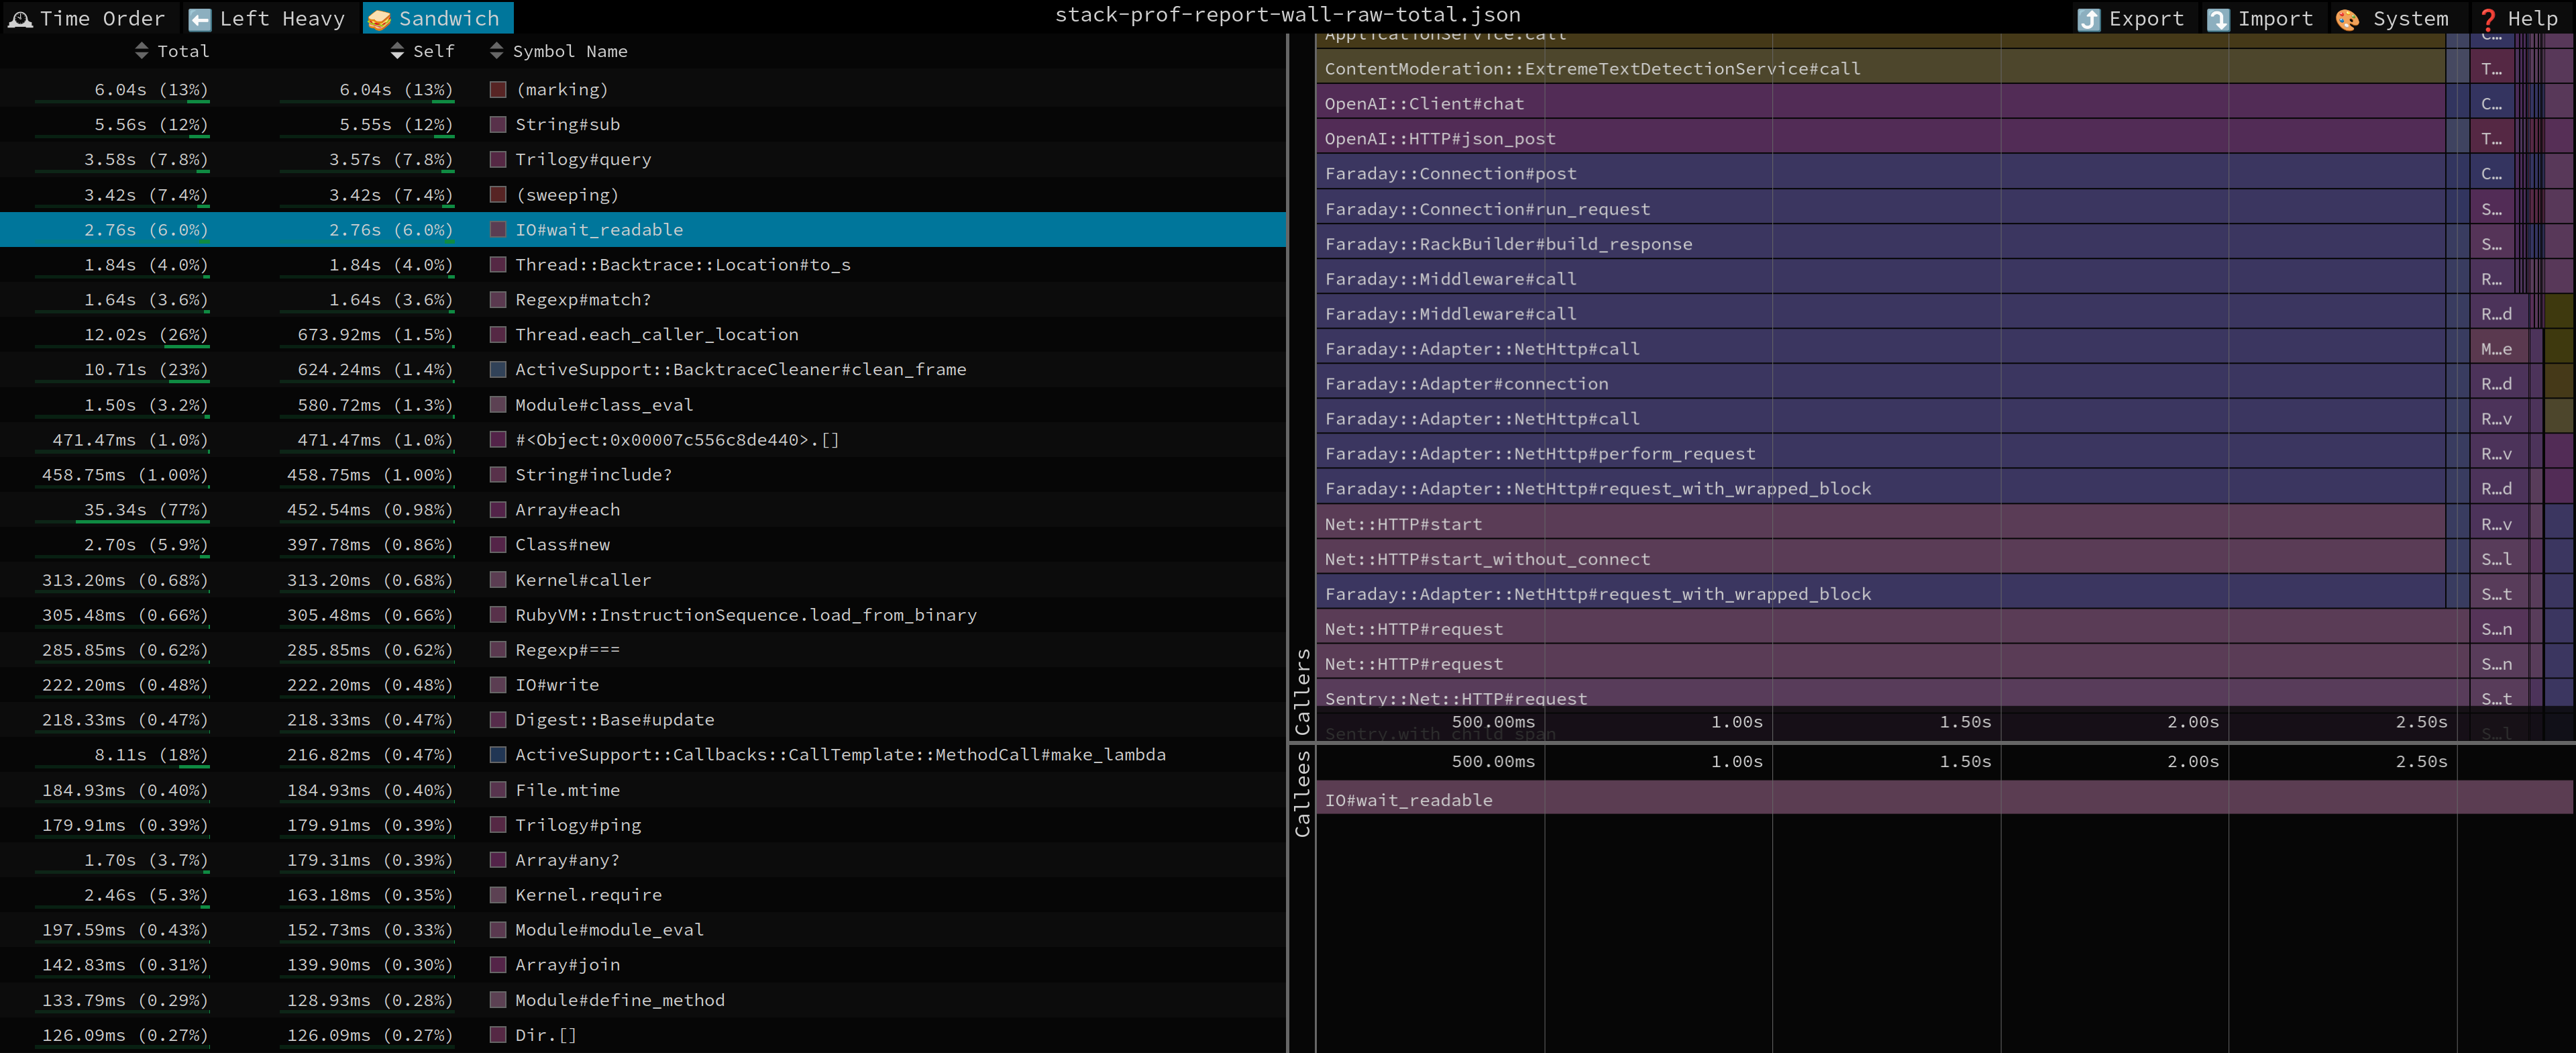
The command above generates a stack-prof-report-wall-raw-total.json file inside the tmp/test-prof/ directory. We can then open this file in a browser using the free and phenomenal speedscope.app.
Inside Speedscope, the “Sandwich” view is usually the most insightful. It displays a list of methods, sorted by the total time spent inside of them (and the methods they call).
The initial profile quickly pointed to a few suspects:
- Heavy database activity (
Trilogy#query), suggesting lots of factories or queries. - Calls to external services like Stripe and OpenAI that should be mocked.
- And, most curiously, a significant amount of time spent in logging.

Aha! The hidden loggers
Logging in a test environment is almost always pure overhead. Our StackProf report pointed directly to logger-related activity, and the primary culprit turned out to be hiding in plain sight: Rails’ own verbose SQL logging.
It turned out that every single database query was being meticulously written to disk, complete with performance tags. This is useful for debugging in development but it creates a massive I/O bottleneck during a test run involving thousands of queries.
Disabling this feature gave us the single biggest performance boost of the entire project. The fix was straightforward in config/environments/test.rb:
# config/environments/test.rb

# These two lines were the source of the major slowdown
config.active_record.verbose_query_logs = false
config.active_record.query_log_tags_enabled = false

# We also raised the log level to further reduce I/O
config.log_level = :fatal
While we were investigating, we noticed another, smaller source of log noise: a custom Sentry logger (app/services/sentry_log.rb) was still active, even though the main gem was disabled for the test environment.
To eliminate this secondary overhead, we took inspiration from Sidekiq::Testing.fake! and implemented a method
to completely defang Sentry during tests:
# spec/rails_helper.rb

RSpec.configure do |config|
  config.before(:suite) do
    # ... other setup
    Sentry::Testing.fake!
  end
end
Unlocking a 2x speed boost
The impact of these changes was immediate and staggering. Together, they cut the total test time in half:
Single Process Run:
- Before: ~25 minutes
- After: ~12 minutes
CI Run (16 parallel processes):
- Before: ~4 minutes
- After: ~2 minutes
Disabling the verbose query logs did the heavy lifting, with the Sentry optimization providing an additional gain. Primarily by eliminating ActiveRecord’s own noisy logging, we had doubled our test speed.
With the most significant bottleneck gone, it was time to hunt for smaller wins.
Part II: taming the factory beast
With the logging monster slain, our profiler pointed to a new, more predictable culprit: object creation. In most Rails test suites, this means FactoryBot. Our goal was to reduce the number of expensive database records being created, one test at a time.
Getting a bird’s-eye view with TagProf
First of all, we needed to confirm our suspicions, and TestProf’s TagProf is perfect for this kind of task. It groups profiling data by “tags,” allowing us to see which types of events are most expensive.
We configured it to watch for ActiveRecord queries, factory creations, and Sidekiq jobs:
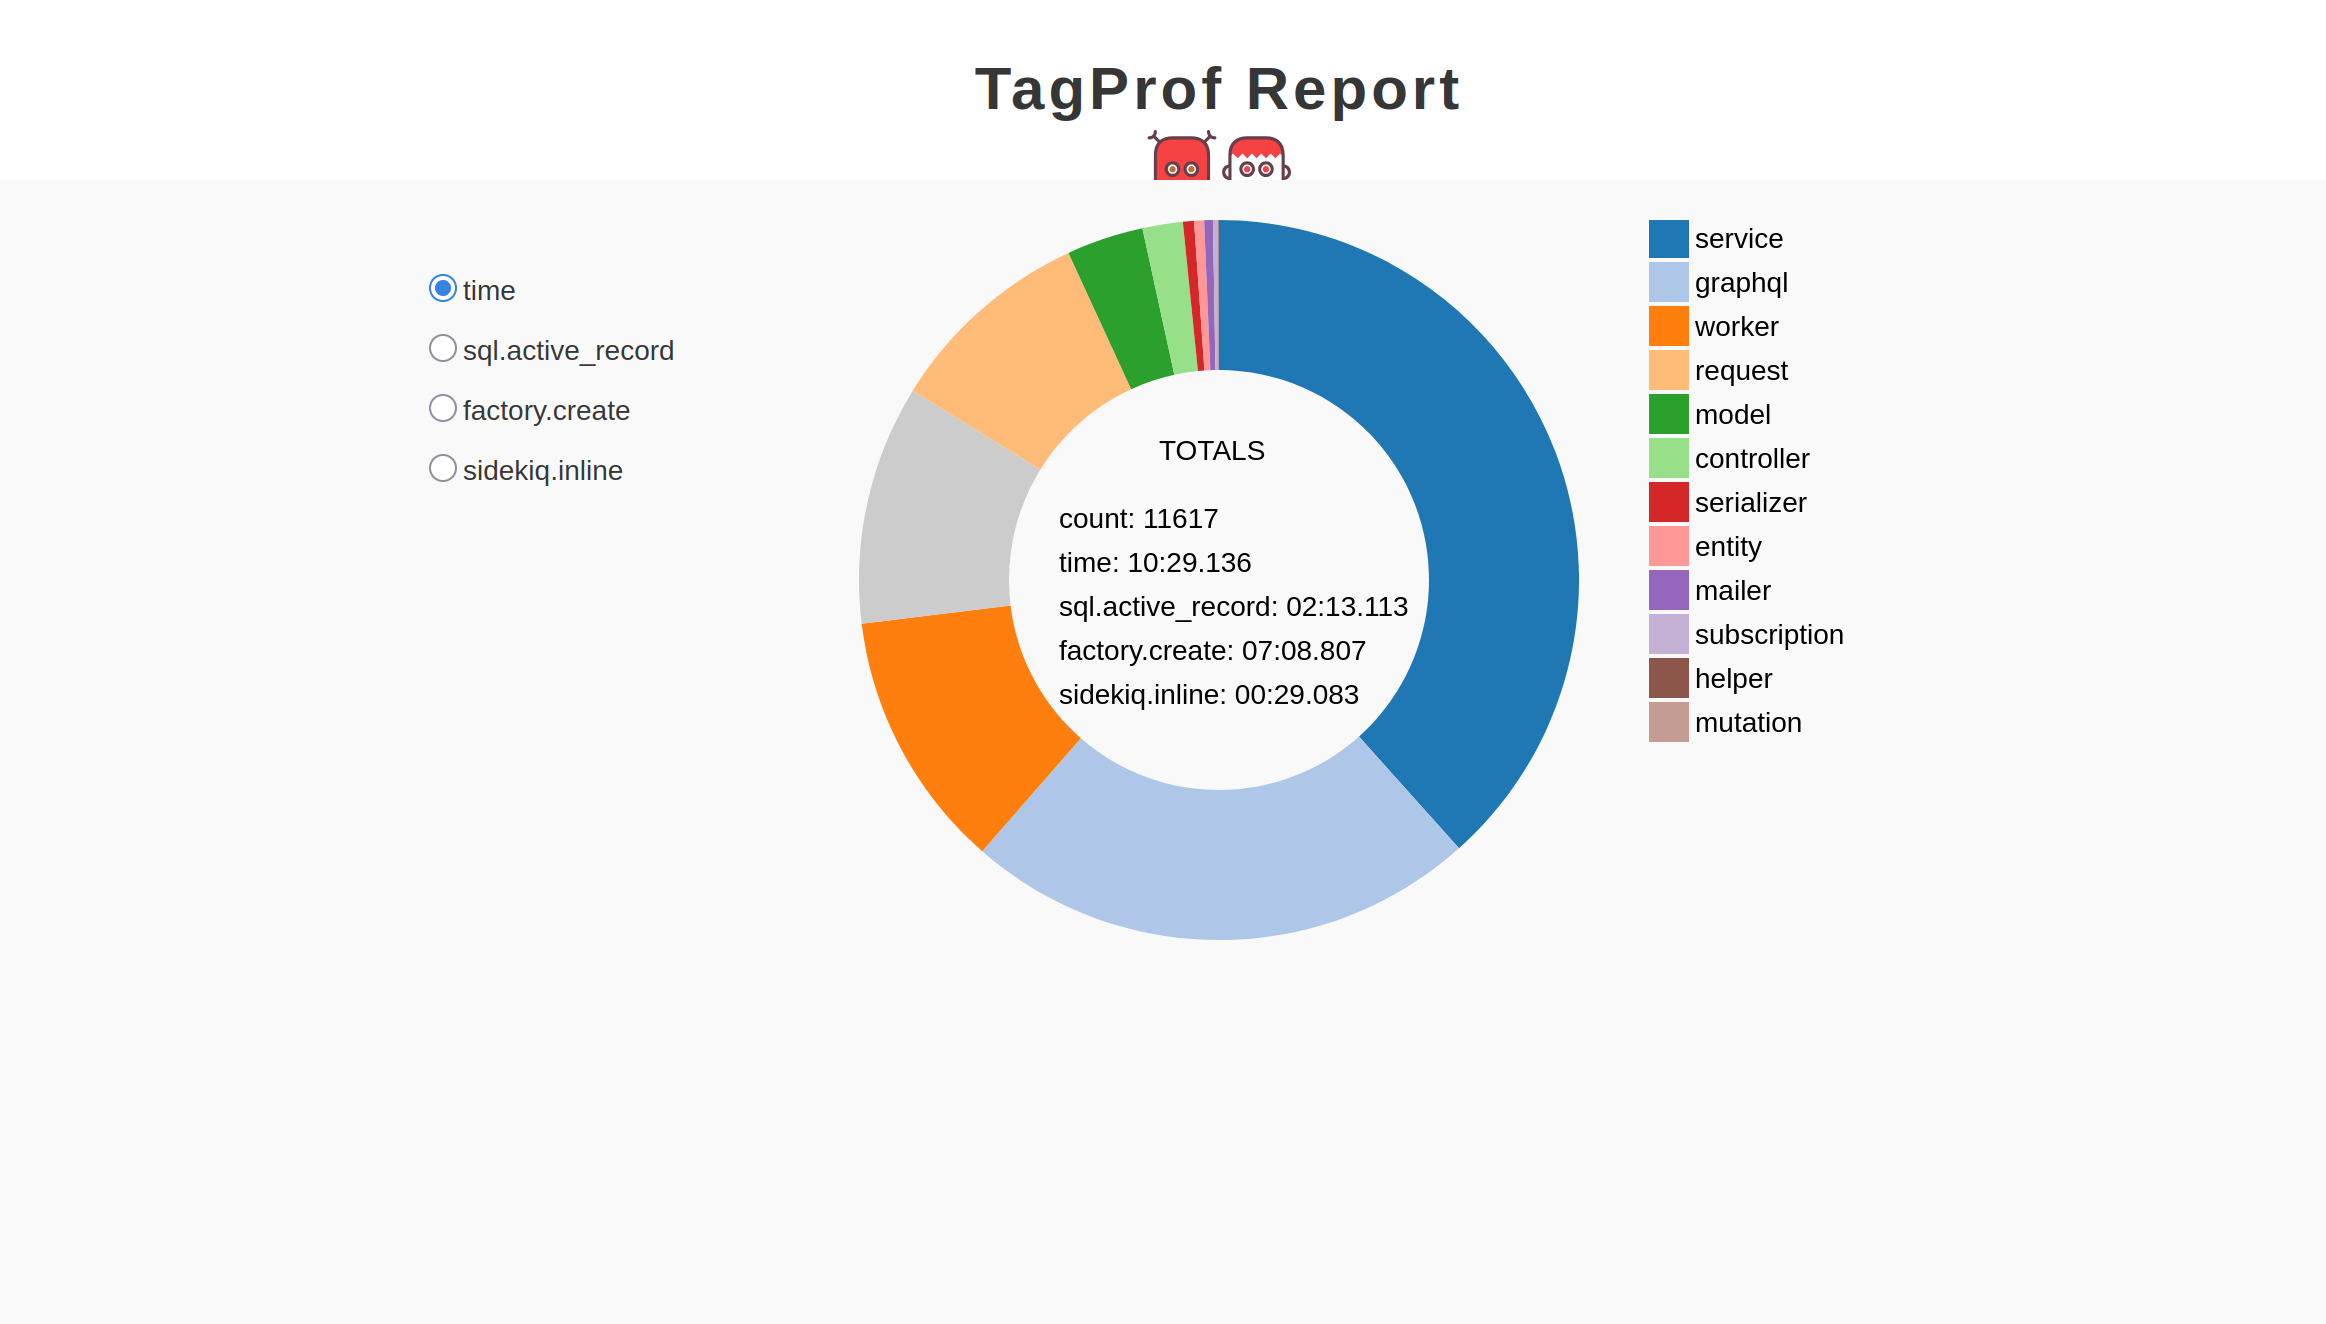
TAG_PROF_FORMAT=html TAG_PROF=type \
TAG_PROF_EVENT=sql.active_record,factory.create,sidekiq.inline \
bundle exec rspec
The resulting HTML report was crystal clear: factory.create events were now responsible for more than half of the total test execution time.

Strategy 1: let_it_be
A common testing pattern is to create the same basic data for every single example in a group.
let_it_be from TestProf is the cure here. Unlike RSpec’s standard let, it creates the record once for the entire describe block, reusing it across all examples.
This is a powerful tool, but it’s not a silver bullet. You have to be careful not to use it on objects whose state is modified by one test, as that state can “leak” into the next, causing flaky results.
Strategy 2: FactoryDefault
The second, more subtle problem was redundant association creation.
Often, a factory for one model will trigger the creation of several other associated models (an experience creates a bot, which creates a user, and so on.)
To hunt down cases like this, we used FactoryDefault’s profiler on a specific heavy test file which we had earlier identified:
FPROF=1 FACTORY_DEFAULT_PROF=1 bundle exec rspec spec/services/some_heavy_spec.rbThis command gives us two incredibly useful tables.
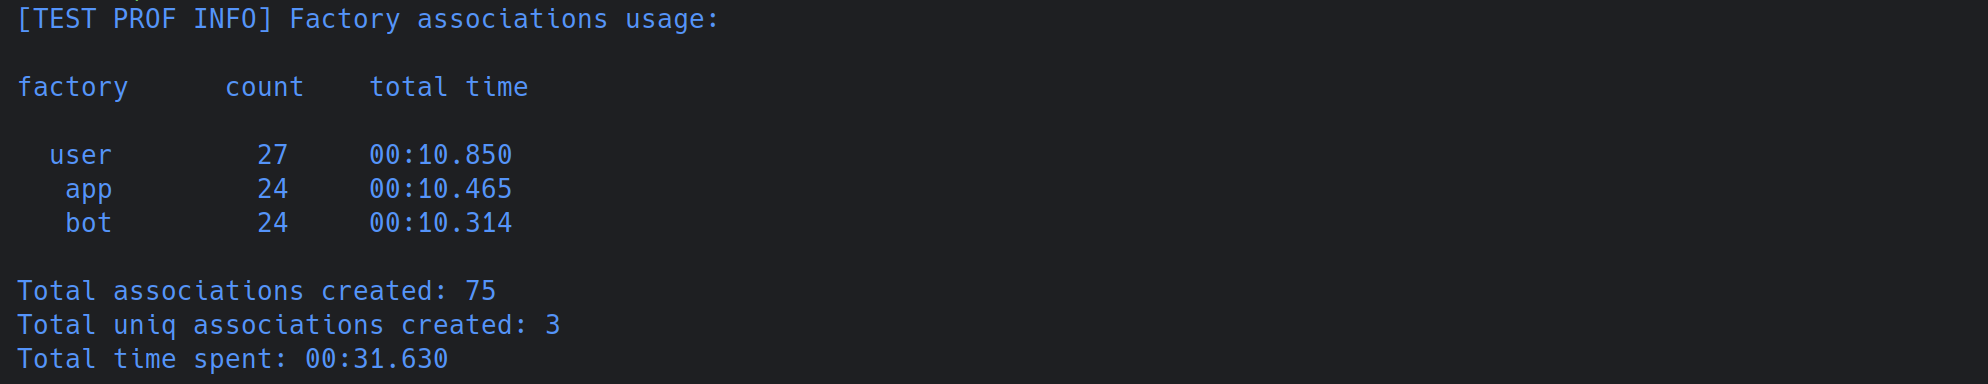
The first, Factory associations usage, shows which objects are being created as a side effect of other factories.
In our case, we can see that user, app, and bot are each created over 20 times just to serve as associations, taking more than 10 seconds of test time each.

The second table shows overall factory usage, distinguishing between “top-level” (explicit) creates and the “total” count including associations.

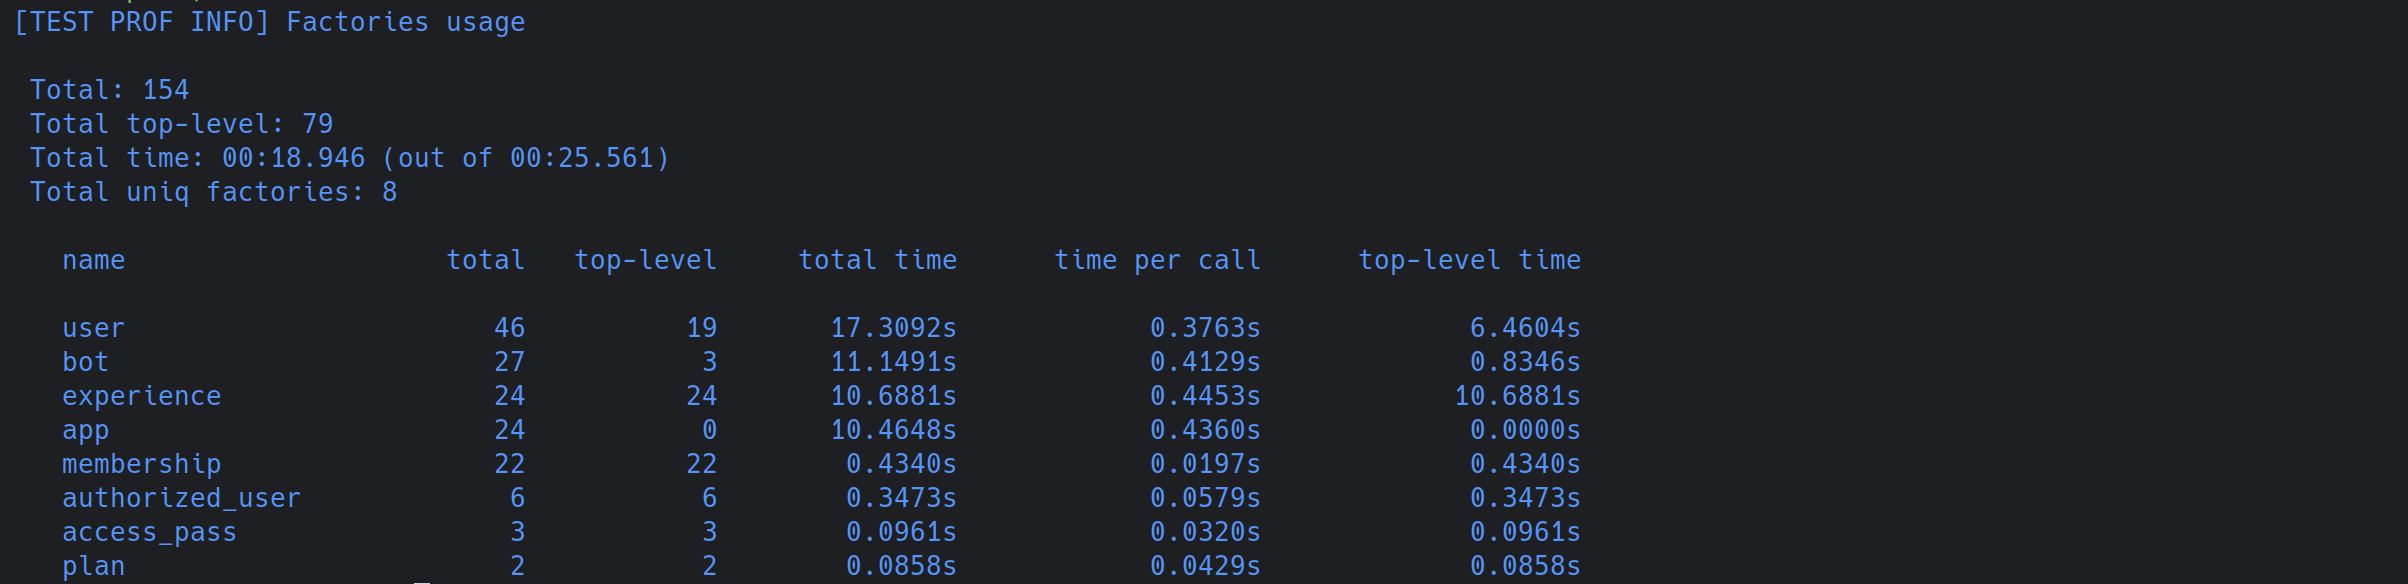
The data here is revealing. We see the user factory was explicitly created (top-level) 19 times. However, the total number of creations is 46. The difference (27 implicit creations) perfectly matches the count from the associations usage table.
The fix is to use create_default. This creates one instance of a commonly used association and tells all subsequent factories in that test to reuse it instead of creating new ones:
# spec/services/some_service_spec.rb
describe "Some Service" do
  # Any factory that needs a :user will now reuse this one
  # instead of creating a new one every time.
  let!(:user) { create_default(:user) }

  it "does something with a widget" do
    widget = create(:widget) # implicitly uses the default user
    # ...
  end

  it "does something with a gadget" do
    gadget = create(:gadget) # also implicitly uses the default user
    # ...
  end
end
By first identifying the slowest test files (using rspec --profile or TestProf’s Time-per-example profiler (TPSProf)) and then running the FactoryDefault profiler on them, we were able to surgically optimize the worst offenders.
We were making steady progress, but we were also approaching the point of diminishing returns. To get the next big leap in performance, we had to look beyond making individual tests faster. We needed to run them all at the same time, more efficiently.
Part III: entering a parallel universe
We had profiled, patched, and optimized our way to a 2x speedup. The suite was faster, but we knew we could push it further.
The final frontier was true parallelization.
The limits of parallel_tests
Like many Rails projects, Whop was using the venerable parallel_tests gem. It’s a workhorse, but it has a fundamental limitation: it works by splitting test files among a set of processes.
So, if you have one worker that happens to get a group of slow, heavy feature specs, it will churn away long after the other workers have finished their quick unit tests and are sitting idle. And the total build time is always dictated by the slowest worker.
A more fair model: test-queue
To solve this, we decided to switch to test-queue, which has a model that is far more efficient.
Instead of pre-assigning files, test-queue creates a central queue of individual test examples. As soon as a worker process finishes a test, it immediately grabs the next one from the queue. This ensures all workers stay busy until the very end, promising a 20-40 second reduction in CI time.
A sea of red
We implemented the switch, pushed the change, and watched the CI pipeline run. The result? Chaos!
Over 100 tests failed. The errors were bizarre and seemingly random, with no obvious connection to our changes.
6) Types::Output::CreatorDashboardTableType ... returns the correct traffic sources Failure/Error: expect(subject["..."]["trafficSource"]).to eq("direct") Expected "whop" to eq "direct".And:
7) Discovery::FetchContentRewardsCampaigns returns the campaigns ordered newest correctly Failure/Error: expect(result[0].id).to eq(low_paid_campaign.id) Expected 691 to eq 693.The tests were fine when run individually, but they collapsed in the truly random, high-concurrency environment of test-queue.
We had not only switched runners; we had put our test suite under a microscope that mercilessly exposed every hidden dependency and every bit of “leaky” state between tests.
And thus, our performance quest had transformed into a debugging odyssey. So, to make our tests faster, we first had to make them perfectly isolated.
It was time to hunt down these flaky beasts, one by one.
Part IV: A guide to isolation
A fast test suite is useless if it’s not reliable. Our new test-queue setup had exposed years of hidden state leakage. Our job was to hunt down every single “flaky beast” and enforce perfect test isolation.
This is the story of that hunt.
Case study #1: time travel and paradoxes
For us, the most common and confusing flakes were all related to time.
The global leak
At first, we saw widespread failures in any test with date filters. The cause was simple: a test would use Timecop.freeze but would never call Timecop.return. This “frozen” time would then leak into the next test run by that worker. The fix was a robust, global failsafe in rails_helper.rb:
# spec/rails_helper.rb
RSpec.configure do |config|
  config.after(:each) do
    Timecop.return
  end
end
The doorkeeper mystery
This failsafe fixed most issues, but the most challenging mystery remained: random 403 Forbidden errors in controller specs using Doorkeeper.
To find the source of this state leak, we turned to RSpec’s ultimate tool: --bisect. By feeding it the seed from a failed CI run, we could automatically hunt down the minimal test sequence that reproduced the error:
bundle exec rspec spec/controllers --bisect --seed 12345RSpec pointed to a test in events_controller_spec.rb. The root cause was subtle but deadly in a parallel world. The test would freeze time to a date in the past. When another test on a parallel worker created a valid Doorkeeper token, it was created in the present. But when that token was validated, the “frozen” past time from the other test made it appear expired, leading to a 403.
The fix was shockingly simple: the Timecop.freeze call was completely unnecessary for the test’s assertions. Deleting that single line fixed the entire cascade of failures.
Case study #2: cleaning up global pollution
Several other issues followed a similar pattern: a test would alter a global state and fail to clean up after itself.
The Constants Conflict: We saw NoMethodError because two different test files were defining a constant with the exact same name but different values. Since constants are global, the last one to run would win.
The fix: We renamed the constants to be unique to each file.
Leaky Caches & Configurations: A PermissionsManager was caching roles in memory globally, causing stale data to leak between tests.
The fix: A cleanup hook in rails_helper.rb to call PermissionsManager::SystemRoles.clear_cache! before every run.
One spec was initializing a global gRPC client but never resetting it.
The fix: An after hook was added to reset the configuration to nil.
The Sidekiq Enterprise unique! Mode Leak:
This was a particularly interesting case.
The problem was that a specific test needed to verify the behavior of Sidekiq Enterprise’s unique! mode. This global change would then “leak” out, causing a completely unrelated test in connected_account_spec.rb to fail because a job it expected to enqueue was being silently filtered out by the uniqueness logic.
We also had a dilemma here: the official Sidekiq Enterprise documentation explicitly warns against this, advising developers to disable uniqueness in tests to avoid “much head scratching.” However, for this feature at Whop, testing the uniqueness logic itself was critical. We couldn’t simply ignore it.
The fix: The challenge was to test this “untestable” feature in perfect isolation. The solution was a meticulously crafted around hook that creates a temporary, safe “sandbox.”
# The official docs advise against this, so we built a fortress.
# This hook creates a perfect sandbox for testing Sidekiq Enterprise's
# unique jobs feature without it leaking into other tests.
around do |example|
  # 1. Turn on the global unique jobs middleware
  Sidekiq::Enterprise.unique!

  # 2. Run the test inside this unique-enabled state
  example.run
ensure
  # 3. GUARANTEE cleanup, even if the test fails.
  #    First, surgically remove the middleware...
  Sidekiq.configure_client do |config|
    config.client_middleware do |chain|
      chain.remove Sidekiq::Enterprise::Unique::Client
    end
  end

  # 4. ...then reset Sidekiq testing back to its default state.
  Sidekiq::Testing.fake!
end
The key is the ensure block, which guarantees that our test cleans up after itself, no matter what. It doesn’t simply reset the testing mode; it surgically removes the specific middleware that unique! adds to the client configuration.
This allowed us to confidently test a critical piece of infrastructure logic while making sure it had zero impact on the stability of the rest of the test suite.
Faster, stronger, better
Our journey to speed up Whop’s test suite started with a simple goal: make the tests faster.
Beyond a faster test suite, we also got a more robust, reliable, and disciplined one.
The initial 2x speed boost from fixing hidden loggers was a massive win, but the real prize was won from fighting flaky tests. By switching to test-queue, we forced ourselves to confront every leaky abstraction and stateful dependency, and the suite is profoundly better for it.
Let’s leave you with some key lessons from this case:
- Your biggest performance bottleneck is rarely where you think it is. Tools like StackProf are your best friend, and you should use them before you change a single line of code.
- Factory usage is often the next biggest bottleneck and tools like
let_it_beandcreate_defaultcan cut redundant work dramatically. - Beware of Hidden I/O. Logging is a notorious performance killer. Scrutinize not only Rails’ defaults but also any third-party gems like Sentry that might be writing to disk or the network.
- Adopting a fairer parallel runner like test-queue is a powerful optimization, but it’s also the ultimate stress test for your suite. It will mercilessly expose every flaw in your test isolation.
- Every test must clean up after itself completely. So, master tools like
rspec --bisectto hunt down leaks and use robust patterns like around hooks to contain tests that modify global state. Be a good citizen!