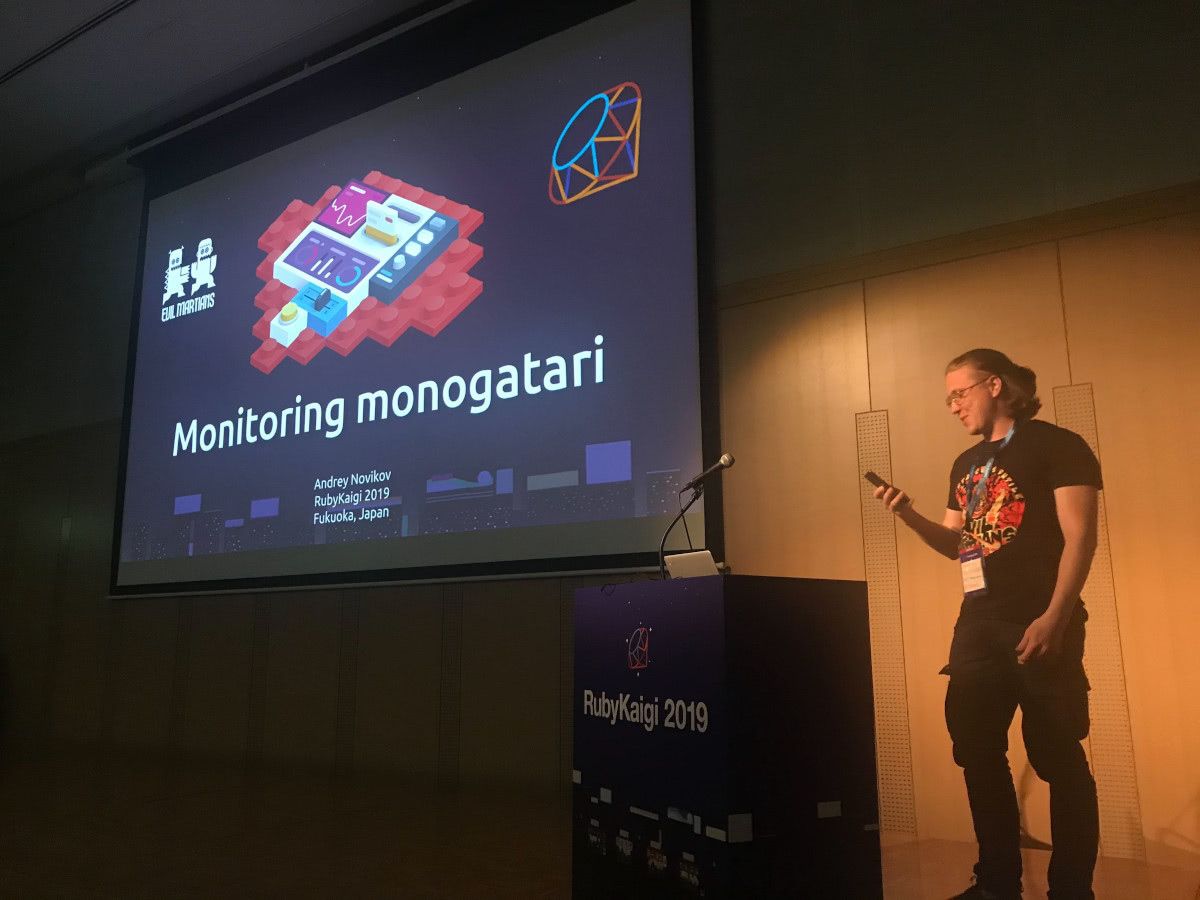
On an example of Sidekiq, Prometheus, and Grafana, we will learn how to gather metrics from a Ruby application, what we can see from their visualization, and I will tell a couple of sad tales about how it helps in an everyday developer’s life (with a happy end!)
Developing large and high-load applications without monitoring is a complex and dangerous task, just like piloting an aircraft without a dashboard. Why is it so important to keep an eye on how the application’s “flight” goes, what things you should care more about, and how graphs may help to resolve occurring performance problems quickly?
Video
Slides
Resources
The following resources were mentioned during the presentation or are useful additional information:
In the same orbit
Explore more events
- Writing DSL for DSL: Catch Code as It's Born with TracePoint
Writing DSL for DSL: Catch Code as It's Born with TracePoint
RubyKaigi 2026![Cover for Writing DSL for DSL: Catch Code as It's Born with TracePoint]()
- Nuances of running Ruby on Kubernetes
Nuances of running Ruby on Kubernetes
RubyConf Taiwan x COSCUP 2025![Cover for Nuances of running Ruby on Kubernetes]()


