Martian Kubernetes Kit: unboxing our toolkit's technical secrets
Topics
Kubernetes is an obvious choice for container orchestration; it provides a framework for automating the deployment, scaling, and management of containerized applications. But, setting up a cluster can be daunting. Enter Martian Kubernetes Kit! It simplifies the process, so you can focus on app development instead of underlying infrastructure. Read on to learn how it works!
Other parts:
- Martian Kubernetes Kit: a smooth-sailing toolkit from our SRE team
- Martian Kubernetes Kit: unboxing our toolkit's technical secrets
- Martian Kubernetes Kit: running apps—and running them well
In the last post of this series, we gave a high-level overview of the Martian Kubernetes Kit. In this article, we’ll begin a closer look at its technical side, beginning with an explanation of the infrastructure and continuing with deployment in a future installment.
We designed the Martian Kubernetes Kit to simplify life for our clients and to improve their overall experience using Kubernetes, letting organizations focus more on application development instead of the underlying infrastructure.
Creating a ready-to-deploy setup of this kind involves a series of decisions that can only be properly made based on real experience with these technologies. So, in this article, we’ll draw back the curtain a bit on those decisions as we discuss in detail the tools and templates we use, setting up a new client, and getting a basic infrastructure running in less than two days.

Irina Nazarova CEO at Evil Martians
Decision 1: infrastructure as code with Terragrunt
It’s not enough to just create a cluster in a GKE or EKS—you need VPCs, IPs, and other components that tie the cluster to the surrounding infrastructure. This means we can’t avoid describing our infrastructure as some repository-stored configuration. Traditionally, Terraform has been our go-to tool for the job, but we needed even more flexibility and modularity, so our first decision was to use Terragrunt.
Terragrunt acts as a thin wrapper around Terraform and enhances its workflow by adding features for code reuse, remote state management, dependency management, and environment-specific configurations. One of our favorite things is that each Terragrunt module has its own independent Terraform-state, which means a much lower chance of breaking one part of your infrastructure when changing another part.
The great thing about Terragrunt is that it adds almost no new abstractions.
You’ll still use the familiar HCL, import the same modules from the Terraform Registry, and, of course, you can use plain tf files, just like with Terraform. If you’re already using Terraform, we recommend trying Terragrunt—it can make life much easier.
Decision 2: Terraform shouldn’t be responsible for anything inside Kubernetes and its API, so, enter Argo CD
An empty running cluster is obviously awesome, right? But the idea behind Martian Kubernetes Kit is that it is a comprehensive solution, so it won’t stay like that for long.
We need to load some tools to get a usable project environment. How do we do that? Obviously, the first idea that comes to mind is to continue using Terragrunt/Terraform and just bootstrap every common part, controller or any other application inside Kubernetes with it. But we have a problem: Terraform maintains its state, which changes only during the application of the Terraform code. However, Kubernetes is a dynamic and fluid environment designed to constantly monitor its state and immediately react to any required changes.
In dynamic Kubernetes environments, keeping this state consistent and up-to-date can be challenging. Every change in the infrastructure needs to be accurately reflected in Terraform’s state file, and any discrepancies can lead to significant issues during deployment or updates. That’s why a different tool is needed to solve that, in our case: Argo CD.
This was our next crucial decision—choosing Argo CD as our main GitOps tool (and it’s great)!
Argo CD relies on a pull-based approach, using Git as the single source of truth. This method naturally aligns with the dynamic nature of Kubernetes, allowing for a more seamless and straightforward management of changes.
We had previously been using another GitOps tool, Flux, for a long time, but at some point, we switched to Argo CD because of the richness of its features. It has an informative UI where application state and logs are easily visible, and you can manually sync or perform a rollback, check the current load on nodes, and more.
It can even display a graph showing data flow from the internet to your application!
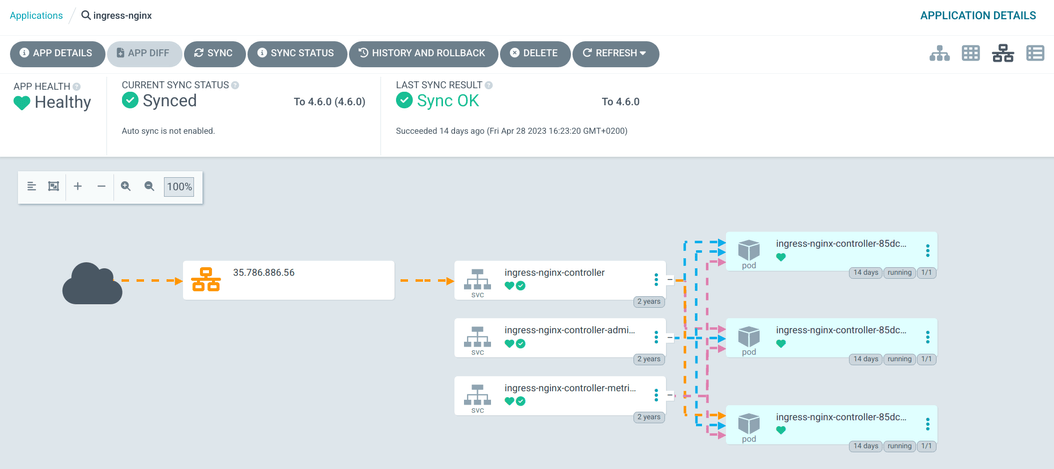
Argo CD can synchronize plain directories of YAML manifests, Kustomize applications, and of course, Helm charts. You can update a Helm chart just by changing its version: Argo CD will download it, show you the difference between the new and current version, then apply it automatically, or it will wait for your approval.
Decision 3: bootstrapping a cluster in order to get Argo CD onto it
We still have an unsolved issue with the initial installation of Argo CD onto the cluster and loading its full configuration. How? This is the place where we had to make another decision. Argo CD doesn’t have a tool for bootstrapping itself. Plus, we also needed to prepare some resources, like secrets, in order for it to access GitHub repositories, set up tokens for sending notifications, and more.
In the end, we decided to go with a shell script that automates all of those steps. Applying this script is a one-time action, so even though we are in 2024, do not be afraid to take advantage of classic techniques to make your life easier.
The goal of the shell script is to perform the following steps:
- Create the
argocddirectory from an existing template and fill it with client information - Generate a deploy key and add it to the client’s infrastructure repository on Github
- Add the Argo CD admin user and the user used during application deployment
- Create Github OAuth applications for login to Argo CD and Grafana via Github account
- Create a Slack channel for monitoring alerts
- Configure the Alertmanager and OpsGenie connection
- Deploy Argo CD to the cluster
Once the script has been run, we’re fully prepared to populate our cluster with all the necessary components, from cert-manager to the monitoring stack.
With that, let’s delve into the world inside the cluster, beginning with the components we deem required.
Decision 4: what should be in the cluster in the first place?
So, now we know that Argo CD is in charge of synchronizing changes from a repository with the cluster and that Martian Kubernetes Kit makes this process nice and easy—but what do we need to bring with this synchronization in the first place?
Again, nobody would be satisfied with an empty cluster. You need MORE tools inside to help your client’s requests reach the application and even MORE tools to monitor it—and some quality-of-life perks wouldn’t hurt to have, either.
We’ve already mentioned some components; now let’s look deeper at some of the most interesting ones:
-
NGINX Ingress Controller is a controller that uses NGINX as a reverse proxy and load balancer to manage external access to services running within a Kubernetes cluster. It provides an entry point for incoming traffic and routes it to the appropriate services based on the defined rules and configurations. Although there are many other ingress controller options on the market, NGINX Ingress Controller is still a great option. It is a commonly known, proven, and well-documented solution.
-
Cert-manager is another Kubernetes controller designed to automate the management and provisioning of TLS certificates. It integrates with the native Kubernetes API and provides a straightforward way to obtain, renew, and revoke certificates from various authorities, including Let’s Encrypt, Vault, and others, which is very useful during development.
-
Prometheus, Grafana, and Alertmanager comprise our monitoring and alerting stack of choice. We have a lot of experience with this setup (more than 7 years now). It’s great for monitoring and visualizing metrics, not only with a Kubernetes cluster itself but for client applications as well. On top of that, Prometheus is pretty cost-effective compared with popular monitoring services, and it has become the de-facto standard, at least to the degree where you pretty much expect any modern software to expose its metrics in Prometheus format. Moreover, we bring along a set of alerting rules that we’ve augmented, covering the common monitoring scenarios for a Kubernetes cluster.
-
Loki and Promtail make up our logging stack for collecting and aggregating logs from every corner of a cluster. Our experience has shown that it is often the best solution to help with log aggregation for jump-starting a new infrastructure. Alongside the previously mentioned monitoring stack, this setup provides a comprehensive, cost-effective observability solution. Native integration with Grafana allows us to leverage Grafana’s rich visualization capabilities to query, explore, and visualize log data stored in Loki.
-
Sealed Secrets Controller is a tool that enables the secure storage and management of secrets in a GitOps-friendly manner. It allows you to encrypt sensitive information (such as API tokens, passwords, or certificates) and store them as sealed secrets in your Git repository. It’s extremely useful for core infrastructure components but not so good for client applications.
Also, there are many additional components that can be enabled at any time during a cluster operation:
-
External-DNS is an add-on that automates the management of external DNS records for services running within a Kubernetes cluster.
-
External Secrets Operator is a tool that enables the secure management of secrets stored in external secret stores such as HashiCorp Vault, AWS Secrets Manager, Google Secret Manager, and many other secret management systems.
-
Postgres Operator is designed to manage and automate the deployment, scaling, and management of PostgreSQL clusters in a Kubernetes environment. It’s an invaluable tool to spin up DBs for staging and preview applications. However, we don’t recommend using an on-cluster PostgreSQL instance within a production environment. For that, consider AWS Aurora or GCP Cloud SQL.
-
VictoriaMetrics is a fast, scalable, and cost-effective open-source time-series database. It’s very useful as long-term storage for Prometheus or in situations where there is more than one Prometheus instance in a cluster.
-
Prometheus Adapter is a component that allows you to use custom metrics collected by Prometheus in Kubernetes Horizontal Pod Autoscaling (HPA) and custom metrics APIs. It acts as a bridge between Prometheus and Kubernetes, enabling the consumption of Prometheus metrics for application scaling and monitoring purposes.
Decision 5: making the Martian Kubernetes Kit
We want to jump-start our customers with the basic configuration of cluster components which we’ve been discussing. But, over time, client configurations evolve and start to require a ton of customizations. On top of that, Kubernetes, its environment, and the community are moving forward at lightning speed: new API objects are introduced, old ones are deprecated, and, in general, the software used on Kubernetes clusters is constantly evolving.
While the brilliant doctor House always said, “People don’t change,” infrastructures do, and very quickly.
So, let’s say changes accumulate, and one day, a bug is discovered, and you need to urgently update something. (For instance, updating NGINX Ingress Controller to a new version.) At the same time, as we’ve mentioned, everything Kubernetes is also constantly in motion, ideally with 3–4 regular updates for your infrastructure per year.
With all this in mind, we realized we needed a turnkey solution for our clients that was both versatile and ready to answer the call when faced with the above challenges.
At this stage, a thought occurs, “Wouldn’t it be nice if all the clients referred to some “core” repository that will be easily updatable and will store all the basic infrastructure configurations, keeping their specific changes in local repositories?”
This is precisely the question that led us to the creation of the Martian Kubernetes Kit. It allows us to easily manage different Kubernetes cluster configurations, quickly add new components or update existing ones, simultaneously support multiple application versions for different clients, quickly create autostagings or auto-preview apps, and much more.
Decision 6: what goes into the kit?
The core of Martian Kubernetes Kit is the complex branching Helm chart describing the versions and configurations of various infrastructure components.
The content is divided into several sections:
base: these are the components needed in any cluster:cert-manager,prometheus,grafana,loki, etc.awsorgcp: components specific to the chosen cloud provider, for example,cluster-autoscaler,stackdriver-exporter, and so on.addons: these are optional components that may be useful in different situations:external-dns,postgres-operator,prometheus-adapter, and so forth. These were chosen because we often see the need for them in different infrastructures, although not all the time.
Here is a glimpse into the base section of the Martian Kubernetes Kit core repository:
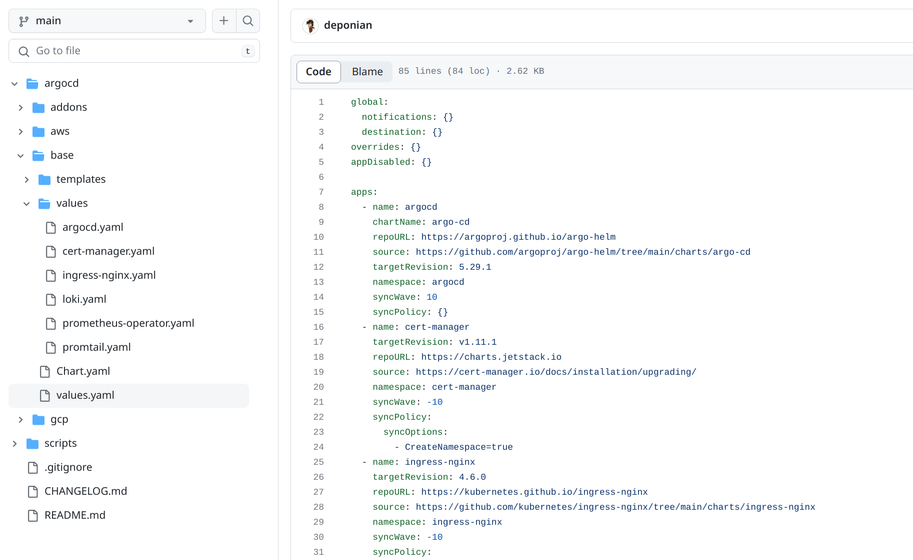
You can see that our configuration is basically a list with components, their versions, and default values—taking this organized approach greatly helps with management and update implementation.
Decision 7: how to manage and reference core repository versions
Managing:
Now that we’ve outlined the solid structure that underlies Martian Kubernetes Kit, let’s move on to the question of ensuring that we’re always consistent with what we deliver.
We made the decision to make each new version of Martian Kubernetes Kit a separate Git repository branch—this has proven to be better than tagging if some emergency changes are required: the branch freezes any changes to the settings and chart versions of each section.
Each release of a new Martian Kubernetes Kit version is most commonly associated with major updates to main charts or with the release of a new version of Kubernetes.
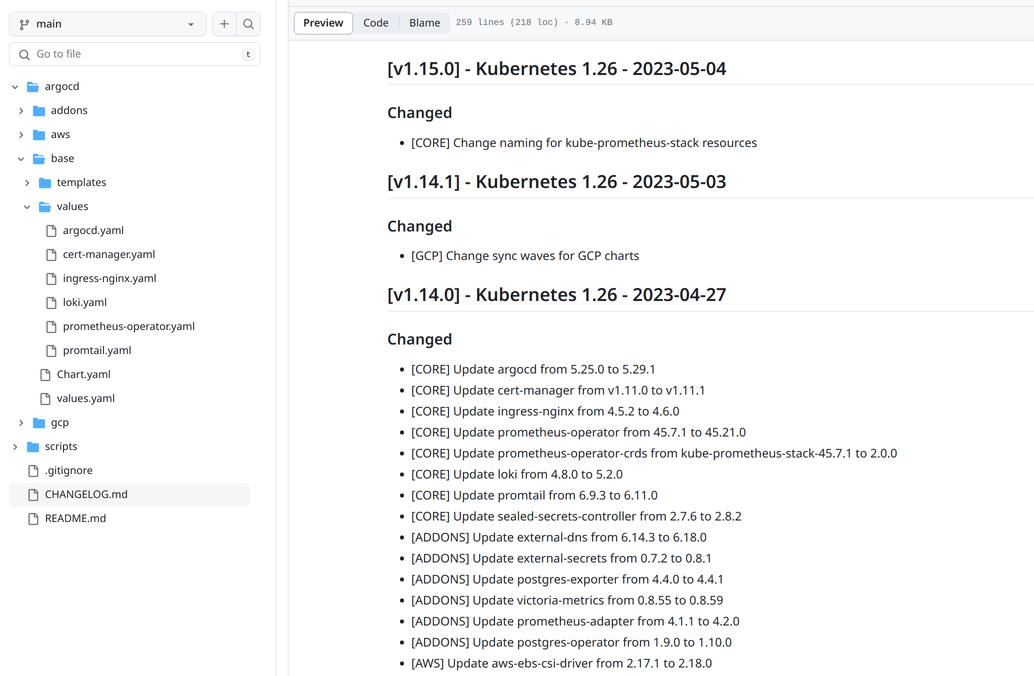
This is what the changelog of the latest versions of MKK looks like:
Referencing:
Now that we have covered the central core repository, let’s turn our attention to how Martian Kubernetes Kit comes into play with the client side.
Each Argo CD repository for a particular client’s infrastructure just points to a specific version of a component in the Martian Kubernetes Kit. Once released, those versions are fixed and no longer change (except in the case of critical bugs).
So, for two hypothetical clients, like “Kuvaq” and “Menetekel”, we can guarantee that they have exactly the same versions of all components inside the cluster (the Nginx versions are the same, the Grafana versions are the same, and so on) if they are set to use the same Martians Kubernetes Kit version.
Of course, any setting can be overridden in the client repository, but this is just a small part of the overall configuration that really only matters to the client (domain names, Github organization name, etc). Thus, we don’t update every single project; we release a new version of Martian Kubernetes Kit first, then switch all projects to it one by one. This is how it looks on the client side:
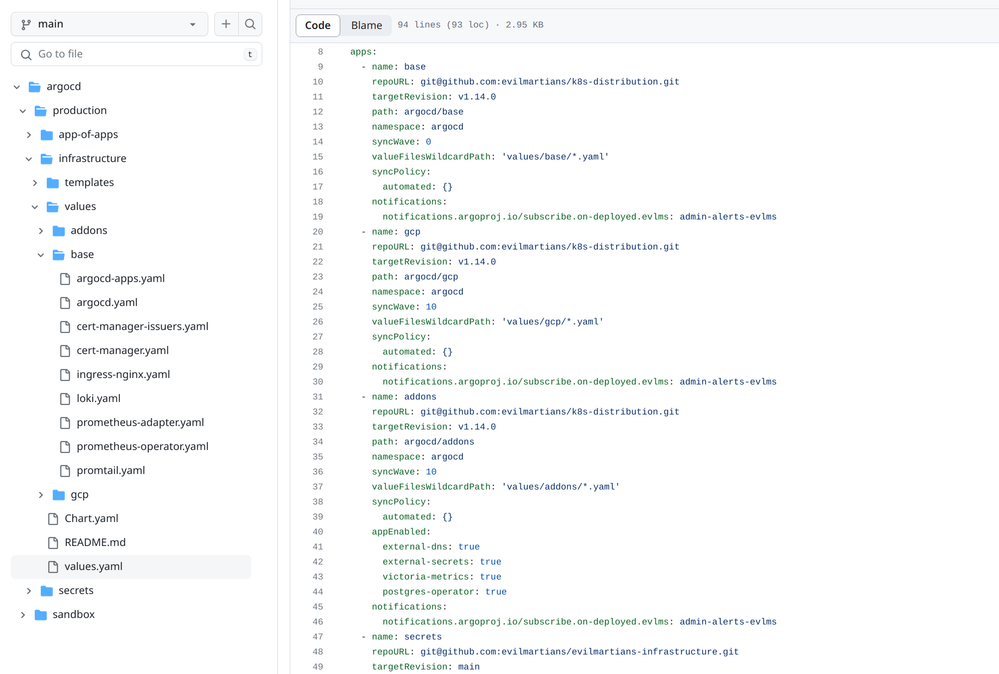
You can see how clients refer to different sections of the core repository, how optional components are enabled from the addons section using the appEnabled list, and also, on the left side in the base directory, you can see where the client personal settings for each component are stored.
Beyond infrastructure
We’ve discussed how we create a cluster and how we populate it with infrastructure components. But we are sure our reader noticed one crucial detail we’re missing: the thing we did all this groundwork for in the first place—the client application. In the next article, we’ll look at how the deployment process works, secrets, and other problems related to the application like creating preview applications.
If your curiosity is piqued, feel free to learn more about our SRE services and reach out to us now. We’ve developed our Kubernetes solution to give our clients maximum benefit and we’re ready to leverage MKK and our experience to help your project adopt it—our team is on standby! Get in touch with us!


