Real-time stress: AnyCable, k6, WebSockets, and Yabeda

So everything is set. Our new and shiny chat feature is up and running. There are unit and integration tests, maybe even 100% coverage. Everything seems working fine. At least for now. On this machine. Under these very stars. But what if one day you hit the orange website and suddenly find yourself handling 10-100x more users? Read on to learn how to reliably test real-time web scenarios with modern tools and minimum effort.
Performance testing is crucial for the healthy uptime. By simulating an increased (load testing) or extreme (stress testing) workload, we can predict how our application would behave and, thus, prevent the potential 5xx errors and service interruptions.
Performance testing is closely related to certain metrics like response time, throughput, and utilization. By measuring them, we can tell exactly when, how, and why our application stops operating normally and where the bottlenecks are.
In this post, we talk about a particular use-case of load testing Ruby WebSocket applications using Action Cable or AnyCable, the more performant alternative for Rails built-in WebSocket server and client. The story goes as follows:
- A quick overview of performance testing tools from ab to k6.
- The existing tools for load testing WebSockets.
- Introducing xk6-cable, a k6 extension to test Action Cable-like servers.
- Load testing meets instrumentation and Yabeda.
From ab to k6
One of the oldest tools (dated back to 1996) and most respected tools for load testing is ApacheBench (or ab). It was developed for benchmarking Apache HTTP servers, but it is also suitable for testing any HTTP-powered backend.
Let’s see how to run 1000 requests with 100 workers using ab:
$ ab -c 100 -n 1000 http://localhost:3000/

This is ApacheBench, Version 2.3 <$Revision: 1879490 $>
Copyright 1996 Adam Twiss, Zeus Technology Ltd, http://www.zeustech.net/
Licensed to The Apache Software Foundation, http://www.apache.org/

Server Software:
Server Hostname:        localhost
Server Port:            3000

Document Path:          /
Document Length:        400856 bytes

Concurrency Level:      100
Time taken for tests:   5.384 seconds
Complete requests:      1000
Failed requests:        738
    (Connect: 0, Receive: 0, Length: 738, Exceptions: 0)
Total transferred:      401960956 bytes
HTML transferred:       400856465 bytes
Requests per second:    185.74 [#/sec] (mean)
Time per request:       538.373 [ms] (mean)
Time per request:       5.384 [ms] (mean, across all concurrent requests)
Transfer rate:          72912.21 [Kbytes/sec] received

Connection Times (ms)
              min  mean[+/-sd] median   max
Connect:        0    0   0.7      0       3
Processing:    10  513  80.4    528     640
Waiting:        8  512  80.4    527     637
Total:         10  513  80.0    529     643

Percentage of the requests served within a certain time (ms)
  50%    529
  66%    535
  75%    541
  80%    545
  90%    554
  95%    563
  98%    576
  99%    582
  100%    643 (longest request)
Here we have latency percentiles and throughput stats—good enough for simple performance testing. What if we need something more than hitting a single endpoint?
If we had written this post a few years ago, I would say—use jMeter. It’s GUI based monstrous piece of software (“j” is for Java). We couldn’t even include a step-by-step Hello World example here because it would turn our article into a three or four-part opus. Let us provide a sneak peek via the screenshot below:
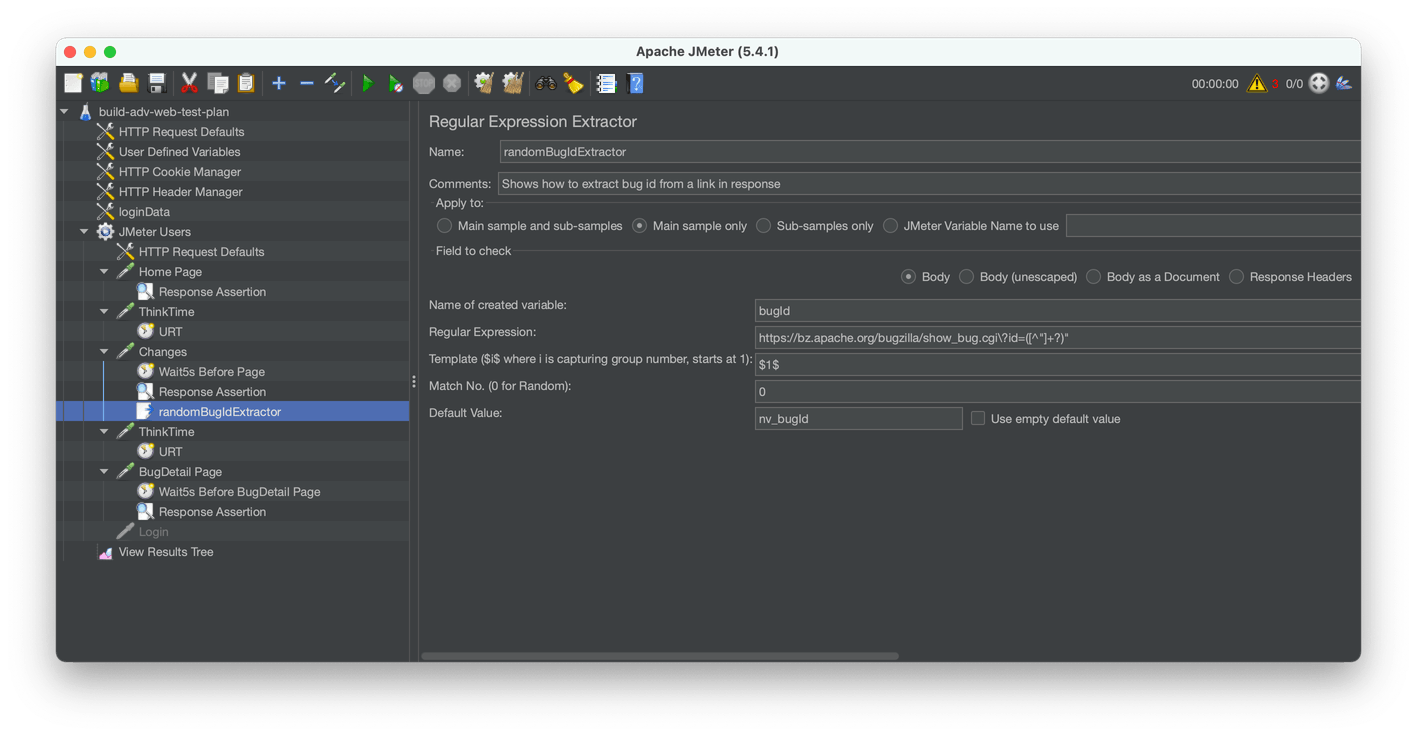
jMeter example
Enough talking about beasts from the past; on Mars, we use a tool called k6.
k6 is a modern performance testing tool that combines the power of a low-level engine (built with Go) with developer-friendly scripting APIs (written in JavaScript). It’s actually more than a tool; it’s a robust framework with many useful concepts: checks, thresholds, executors, etc.
Here is an example of HTTP load test for this particular web page launched locally:
// post.js
import http from "k6/http";
import { check, sleep } from "k6";
import { randomIntBetween } from "https://jslib.k6.io/k6-utils/1.1.0/index.js";

// We want to re-use this script for different posts
const POST_URL =
  __ENV.POST_URL ||
  "http://evilmartians.dev/chronicles/cables-under-stress-of-k6-websockets-and-yabeda";

export let options = {
  // Avoid loading response data into memory, since we only use statuses
  discardResponseBodies: true,
  thresholds: {
    // The test passes if at least 99% of all requests succeeded
    checks: ["rate>0.99"],
  },
  scenarios: {
    post: {
      // Increase the load gradually
      executor: "ramping-vus",
      startVUs: 5,
      stages: [
        { duration: `60s`, target: 100 },
        { duration: `5s`, target: 0 },
      ],
    },
  },
};

export default function () {
  let res = http.get(POST_URL);
  check(res, { "success login": (r) => r.status === 200 });

  sleep(randomIntBetween(5, 10) / 20);
}
Let’s run this script:
$ k6 run post.js

...

running (44.5s), 000/100 VUs, 10 complete and 90 interrupted iterations
post ✓ [======================================] 000/100 VUs  15s

✓ success login

✓ checks.........................: 100.00% ✓ 10       ✗ 0
  data_received..................: 826 kB  19 kB/s
  data_sent......................: 13 kB   301 B/s
  http_req_blocked...............: avg=267.49µs min=185µs  med=263.5µs max=365µs   p(90)=336.2µs p(95)=350.6µs
  http_req_connecting............: avg=137.5µs  min=87µs   med=147µs   max=188µs   p(90)=170.9µs p(95)=179.45µs
  http_req_duration..............: avg=23.54s   min=15.18s med=23.45s  max=32.15s  p(90)=32s     p(95)=32.08s
    { expected_response:true }...: avg=23.54s   min=15.18s med=23.45s  max=32.15s  p(90)=32s     p(95)=32.08s
  http_req_failed................: 0.00%   ✓ 0        ✗ 10
  http_req_receiving.............: avg=3.53ms   min=834µs  med=1.84ms  max=17.22ms p(90)=6.82ms  p(95)=12.02ms
  http_req_sending...............: avg=50.5µs   min=20µs   med=52µs    max=89µs    p(90)=66.49µs p(95)=77.74µs
  http_req_tls_handshaking.......: avg=0s       min=0s     med=0s      max=0s      p(90)=0s      p(95)=0s
  http_req_waiting...............: avg=23.54s   min=15.18s med=23.45s  max=32.14s  p(90)=32s     p(95)=32.07s
  http_reqs......................: 10      0.224709/s
  iteration_duration.............: avg=23.95s   min=15.57s med=23.91s  max=32.55s  p(90)=32.49s  p(95)=32.52s
  iterations.....................: 10      0.224709/s
  vus............................: 11      min=11     max=100
  vus_max........................: 100     min=100    max=100
You can see plenty of information about the performed HTTP requests. For example, we can notice the huge waiting time (23.52s on average)—that’s because we tested against a locally running server with just a single Puma worker.
Modern web applications communicate using the HTTP request-response model and using bi-directional streaming, for example, via WebSockets. And that’s where performance testing becomes much trickier.
Load testing WebSockets
We’ve been doing WebSockets load testing since the first day of AnyCable—about five years ago!
In 2016, there were not so many options. The only existing tool we used back then was Thor, but it only allowed us to perform “thundering herd” tests. For more complicated scenarios, we borrowed custom benchmark tools from the Hashrocket’s popular WebSocket shootout challenge and adopted it to our needs (you can find it here). It still serves us well for AnyCable stress testing where we have just a single Action Cable channel. The only problem with websocket-bench is that it’s not really customizable; you cannot use it to test your particular application. That’s where k6 could be helpful.
Today, k6 provides an ability to test WebSockets out of the box, but the two-way interactive nature of WebSockets impacts the structure of a test script. Now we need to set up an asynchronous event loop, and you’ll see how it affects the readability:
// ws.js
import ws from "k6/ws";
import { check } from "k6";

const WS_URL = __ENV.WS_URL || "wss://ws.demo.anycable.io/cable";
const WS_COOKIE = __ENV.WS_COOKIE; // we need a valid cookie to authorize request

export default function () {
  const response = ws.connect(
    WS_URL,
    { headers: { Cookie: WS_COOKIE } },
    (socket) => {
      socket.on("open", () => {
        let ws_cmd = {
          command: "subscribe",
          identifier: '{"channel":"ChatChannel","id":"demo"}',
        };
        socket.send(JSON.stringify(ws_cmd));

        socket.setTimeout(function () {
          let ws_cmd = {
            command: "message",
            identifier: '{"channel":"ChatChannel","id":"demo"}',
            data: '{"action":"speak","message":"Hello"}',
          };
          socket.send(JSON.stringify(ws_cmd));
        }, 500);
      });

      socket.on("message", (data) => {
        let parsed_data = JSON.parse(data);
        if (parsed_data.type === "confirm_subscription") {
          check(parsed_data, {
            subscribed: (d) =>
              d.identifier === '{"channel":"ChatChannel","id":"demo"}',
          });
        } else if (parsed_data.message && parsed_data.message.action) {
          check(parsed_data, {
            "message recieved": (d) => d.message.action === "newMessage",
          });
        }
      });

      // close socket after 1 second
      socket.setTimeout(function () {
        socket.close();
      }, 3000);
    }
  );
  check(response, { "status is 101": (r) => r && r.status === 101 });
}
Looks massive, right? And that’s just to implement a simple scenario of subscribing to the ChatChannel, sending a message, and receiving it back. Adding more checks and actions will produce spaghetti-er code. Once your test file exceeds 400 lines of code, you might lose it.
Wouldn’t it be great if we could still write a synchronous code while describing WebSockets interaction? In the world of Rails, it also would be great to reduce the boilerplate of writing all these JSONs inside JSONs and connect to channels easily. If only we had a way to extend k6…
Introducing xk6-cable
With version v0.29.0, k6 introduced the xk6 framework along with community extensions. Now we can write our own Go-based extensions and use them as JS modules in our test files. To use it, we need to build a custom k6 binary with the necessary extensions included:
xk6 build --with github.com/anycable/xk6-cableHere we introduce the brand new k6 extension of our own making: xk6-cable. It solves the most common problems we had with cables-related k6 load tests and provides a way to rewrite the monstrous example above like this:
// cable.js
import { check, sleep } from "k6";
import cable from "k6/x/cable";

const WS_URL = __ENV.WS_URL || "wss://ws.demo.anycable.io/cable";
const WS_COOKIE = __ENV.WS_COOKIE; // we need a valid cookie to authorize request

export default function () {
  const client = cable.connect(WS_URL, { cookies: WS_COOKIE });
  // At this point, the client has been successfully connected
  // (e.g., welcome message has been received)

  // Send subscription request and wait for the confirmation.
  // Returns null if failed to subscribe (due to rejection or timeout).
  const channel = client.subscribe("ChatChannel", { id: "demo" });

  // Perform an action
  channel.perform("speak", { message: "Hello" });

  // Retrieve a single message from the incoming inbox (FIFO).
  // Returns null if no messages have been received in the specified period of time.
  const res = channel.receive();
  check(res, {
    "received res": (obj) => obj.action === "newMessage",
  });

  sleep(1);
  // Terminate the WS connection
  client.disconnect();
}
Even with all the comments, this variant is much more concise and easier to digest.
The example above is still a bit artificial. Let us demonstrate a full-featured load testing scenario involving AnyCable Demo application xk6-cable, and instrumentation tools such as Prometheus, Grafana, and our own Yabeda.
Measuring the stress
Performance testing is not only about writing sophisticated scenarios to simulate load. It’s also about capturing the vital metrics of the application under stress and about instrumentation.
Before running a test, we need to formulate the questions we want to answer. For load tests, that could be:
- How much CPU/RAM do I need to handle N users?
- What would be the latency when N users actively use the chat feature?
For a stress test, the questions differ a little bit:
- How many users my current infrastructure could handle without downgrading the performance (with acceptable latency)?
- How many messages per second can we handle?
In both cases, we need a way to measure the characteristics of a system (CPU, RAM, etc.) and the application performance metrics (for instance, latency). System metrics are captured by a monitoring service (a third-party APM like New Relic or DataDog, or a hosted solution like Prometheus). In contrast, the application metrics should be captured during a load test (usually by a benchmark tool).
Let’s move on to our use case—load testing the AnyCable Demo chat feature.
AnyCable Demo chat under load
We want to see how our application behaves under a moderate load (200 concurrent users of a single chat—enough for the demonstration) and compare the results for different WebSocket servers: Action Cable, AnyCable, and AnyCable Pro.
Since we’re running everything locally within a Docker environment, our monitoring system of choice is a combination of Prometheus and Grafana (that’s what we usually use in our Kubernetes projects). AnyCable comes with an advanced instrumentation support and a built-in Prometheus exporter, so it’s just a matter of crafting a dashboard to get useful insights:
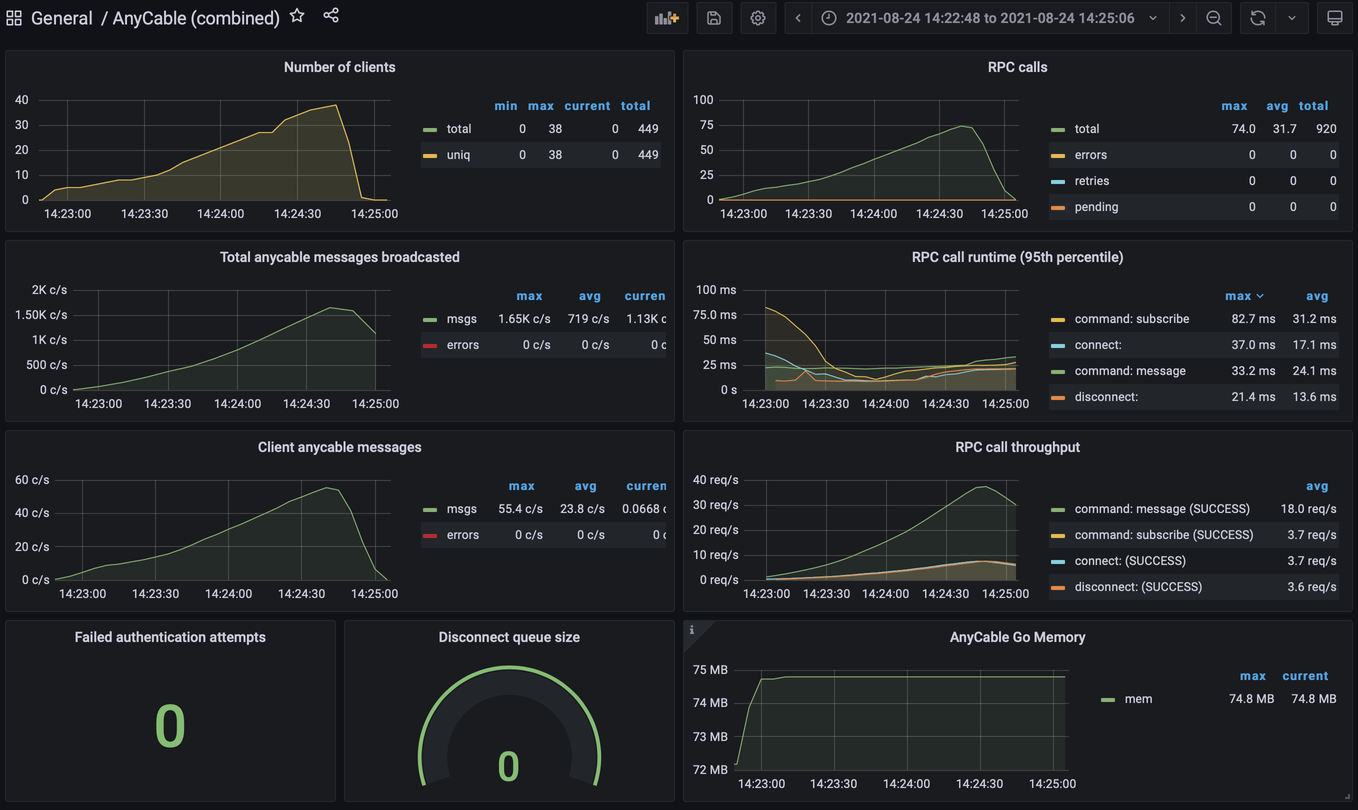
AnyCable Grafana dashboard
Note that we have detailed RPC statistics (calls runtime and throughput per command). That became possible due to the recent addition to the Yabeda family—yabeda-anycable. Make sure you have installed it to add more transparency to what’s happening in your RPC server.
Finally, cAdvisor helps us to get container resources usage information:
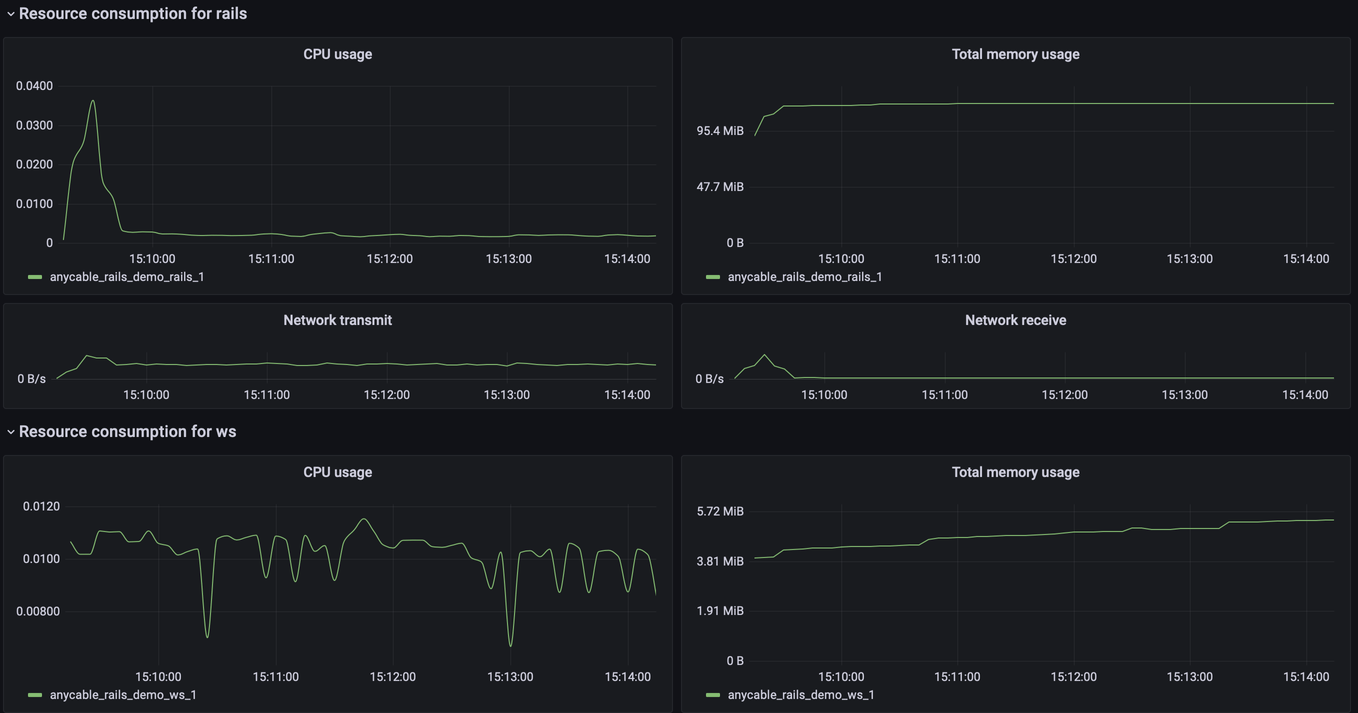
cAdvisor Grafana dashboard
We set up enough instrumentation; it’s time to talk about benchmarking.
We wrote a k6 script to emulate a user connecting a chat, sending a few messages and disconnecting:
// k6/chat.js
import { check, sleep, fail } from "k6";
import cable from "k6/x/cable";
import { randomIntBetween } from "https://jslib.k6.io/k6-utils/1.1.0/index.js";
import { Trend } from "k6/metrics";

// This trend is used to measure the latency (or round-trip time)
let rttTrend = new Trend("rtt", true);

// Generate credentials from the test context
let userId = `100${__VU}`;
let userName = `Kay${userId}`;

// Make URL configurable, so we can use the same script for different servers
const URL = __ENV.CABLE_URL || "ws://localhost:8080/cable";
const WORKSPACE = __ENV.WORKSPACE || "demo";
// The number of messages each VU sends during an iteration
const MESSAGES_NUM = parseInt(__ENV.NUM || "5");
// Max VUs during the peak
const MAX = parseInt(__ENV.MAX || "20");
// Total test duration
const TIME = parseInt(__ENV.TIME || "120");

export let options = {
  thresholds: {
    checks: ["rate>0.9"],
  },
  scenarios: {
    chat: {
      // We use ramping executor to slowly increase the number of users during a test
      executor: "ramping-vus",
      startVUs: (MAX / 10 || 1) | 0,
      stages: [
        { duration: `${TIME / 3}s`, target: (MAX / 4) | 0 },
        { duration: `${(7 * TIME) / 12}s`, target: MAX },
        { duration: `${TIME / 12}s`, target: 0 },
      ],
    },
  },
};

export default function () {
  let client = cable.connect(URL, {
    cookies: `uid=${userName}/${userId}`,
    receiveTimeoutMS: 10000,
  });
  if (
    !check(client, {
      "successful connection": (obj) => obj,
    })
  ) {
    fail("connection failed");
  }

  let channel = client.subscribe("ChatChannel", { id: WORKSPACE });
  if (
    !check(channel, {
      "successful subscription": (obj) => obj,
    })
  ) {
    fail("failed to subscribe");
  }

  for (let i = 0; i < MESSAGES_NUM; i++) {
    let startMessage = Date.now();
    channel.perform("speak", { message: `hello from ${userName}` });
    let message = channel.receive({ author_id: userId });
    if (
      !check(message, {
        "received its own message": (obj) => obj,
      })
    ) {
      fail("expected message hasn't been received");
    }

    let endMessage = Date.now();
    rttTrend.add(endMessage - startMessage);

    sleep(randomIntBetween(5, 10) / 10);
  }

  client.disconnect();
}
That’s all with the preparation. Let’s run the script and capture the results!
Load testing AnyCable with xk6-cable
Okay, we can see a lot of data in our dashboards regarding the application state. The output of the k6 run also produces some stats, but it would be better to have a nicer visualization, don’t you think so? Luckily, k6 covers us here with its k6 Cloud solution.
The cloud version of k6 allows to collect test results and also run and schedule tests. Unfortunately, as of today, there is no support for custom k6 builds (i.e., for xk6), so we can only use the results collection feature.
Using k6 Cloud, we can visualize the target metrics (rtt and ws_connecting) and quickly spot the difference between runs.

k6 Cloud Analytics: Action Cable test

k6 Cloud Analytics: AnyCable test
No surprises: Action Cable performs much worse than AnyCable in terms of latency and connection initialization time.
Let’s take a look at our Grafana dashboard to check the resources usage:

Action Cable resources usage: ~1.5 vCPU and 300MiB RAM
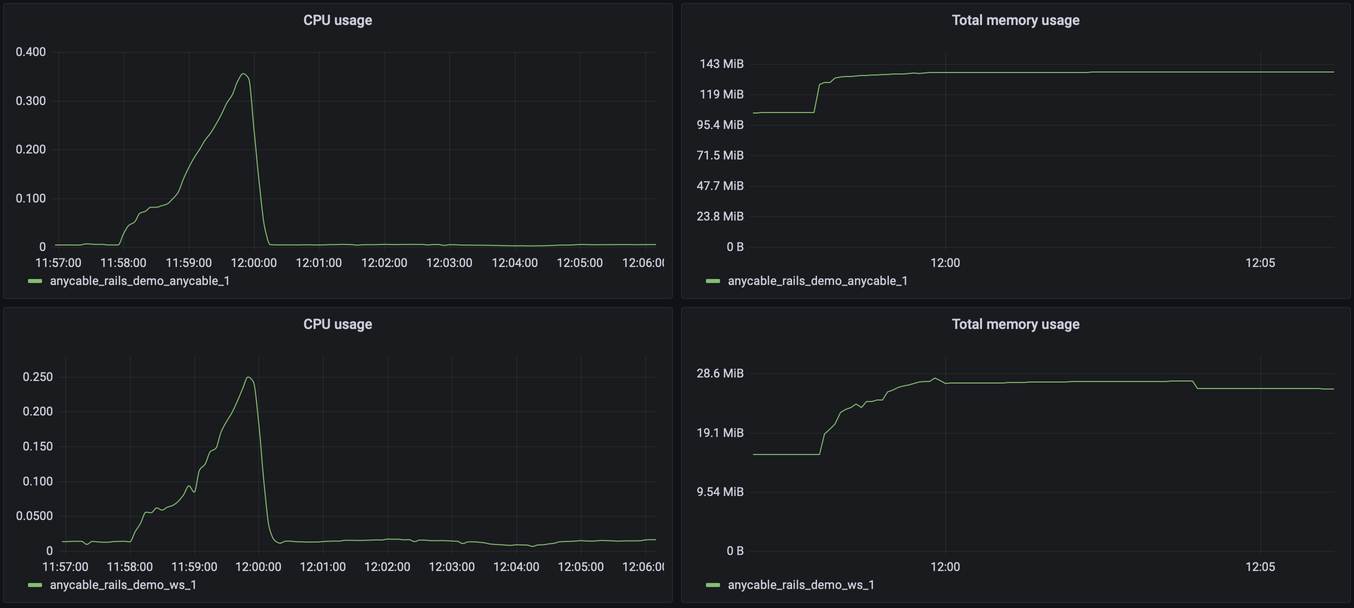
AnyCable resources usage: ~0.7 vCPU and 170MiB RAM
For 200 virtual users, there is no big difference, although we can see that Action Cable starts consuming more memory, and the CPU is working hard.
To see the difference between AnyCable OSS and Pro versions, we must conduct an experiment with thousands of virtual users. Let’s perform a load test for our demo app running on Heroku (demo.anycable.io) and take a look at the Heroku Metrics dashboard:
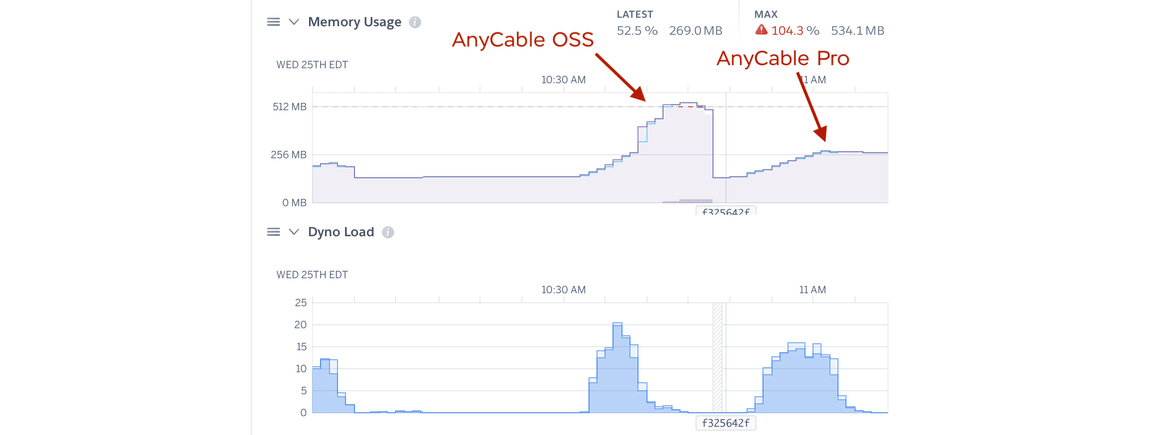
AnyCable & AnyCable Pro on Heroku (1x dyno) handling 5k VUs
Running our chat.js test with 5k virtual users (VUs) causes OSS AnyCable to hit the memory limit and become almost unresponsive 😞. AnyCable Pro proves its performance efficiency by handling all the load without causing system outages 🎉. For comparison (and to dot the i’s and cross the t’s), let me show how Action Cable deals with the same load while running with 8 Puma workers on Performance-L dyno:
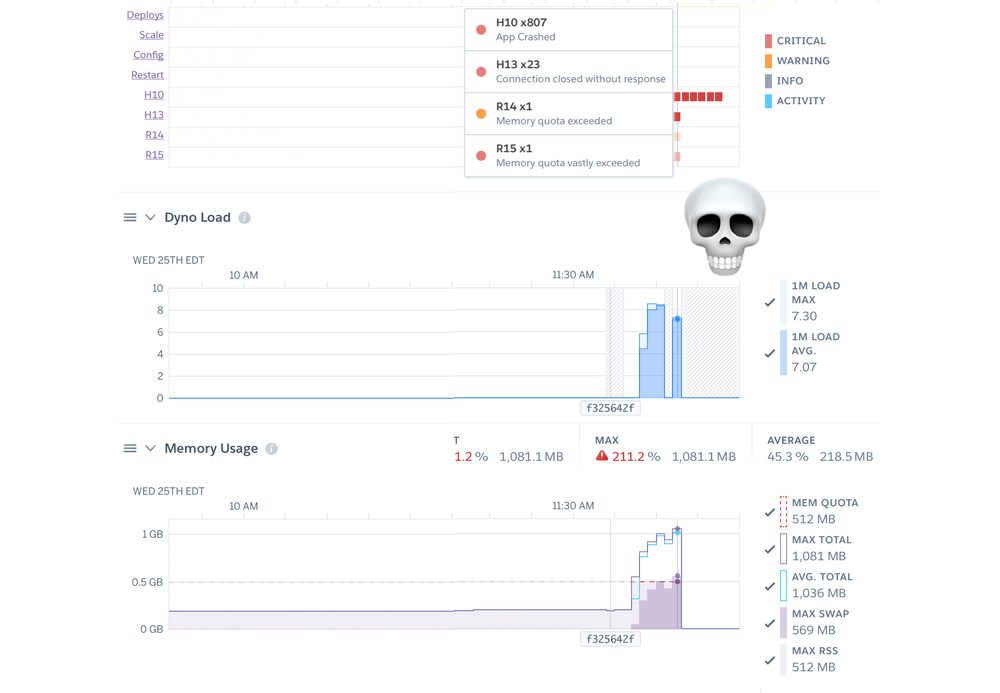
Action Cable on Heroku (P-L dyno) handling 5k VUs
Oops, it just went dead 🤷🏻♂️
It is safe to say that you are much better off with AnyCable for extreme workloads, we particularly recommend AnyCable Pro for handling thousands of users connected in real-time to the same application.
Load testing WebSockets could be tricky, but we hope that with the addition of xk6-cable, it will become more accessible, and more Rails applications will be prepared for Black Fridays, Cyber Mondays, and school vacations. And don’t forget to configure your monitoring dashboards!
Feel free to give us a shout if you’re impressed by just how stress free that stress-testing can be with AnyCable and xk6-cable. To get AnyCable (any of it) visit anycable.io.
AnyCable Goes Pro: Fast WebSockets for Ruby, at scale


