TestProf Digest 2026.4: surprising finds from 30k specs


Behind every release of TestProf is a story about battling a real-world Rails application’s test suite slowness. This time, we’ve picked standout cases from Evil Martians’ recent CI performance gig at Whop. Learn what we used to identify and fix them and how this experience shaped TestProf v1.6.0.

Hire Evil Martians
Slow test suites or long CI times? Evil Martians build custom developer tools and backend solutions to speed up Rails projects and boost productivity.
Slow Rails tests are not something you can fix once and forget about. The application’s codebase keeps growing, and new tests and dependencies are being added. Further, the speed that test suites grow (or bloat?) has increased significantly since we’ve started delegating code writing to AI agents.
Take for example, our work with Whop: in the summer of 2025, we did the first round of test suite optimizations and cut the run time by 50% (from 4min to 2min). The test suite had ~11k RSpec examples back then.


Flash forward to early 2026, the RSpec part of Whop CI builds reached 4min30s with the total number of examples getting closer to ~30k.
Why didn’t the run time triple? During our first landing, we not only applied optimizations but introduced best practices for writing faster tests.
Still, the increase in the test suite time was unacceptably higher than expected, so Evil Martians moved into action again.
Long story short: over the first few days, we identified a handful of global issues and a few particularly slow generated specs and managed to bring the RSpec run time back to ~2min—yes, we cut it by 50% again!
And that’s not the limit: while I’m writing this, we’re approaching 1min30s! (Reminder: we run RSpec tests 16x parallelized using test-queue).
In this post, I want to focus on the most interesting findings that you may have in your test suites:
- Custom RuboCop cops and suspiciously high GC time
- To coverage or not to coverage or how to coverage?
- The cost of encryption
- The most useful metric—tests-per-second
- In the next issues
Custom RuboCop cops and suspiciously high GC time
A typical TestProf-driven way to start profiling a test suite implies profiling small random test samples with Stackprof or Vernier. This way, you can see some global issues: something related to the test environment configuration and, thus, affecting all tests.
After running a few samples, one thing caught my attention—a significant amount of time spent in GC. Here’s a Stackprof report:

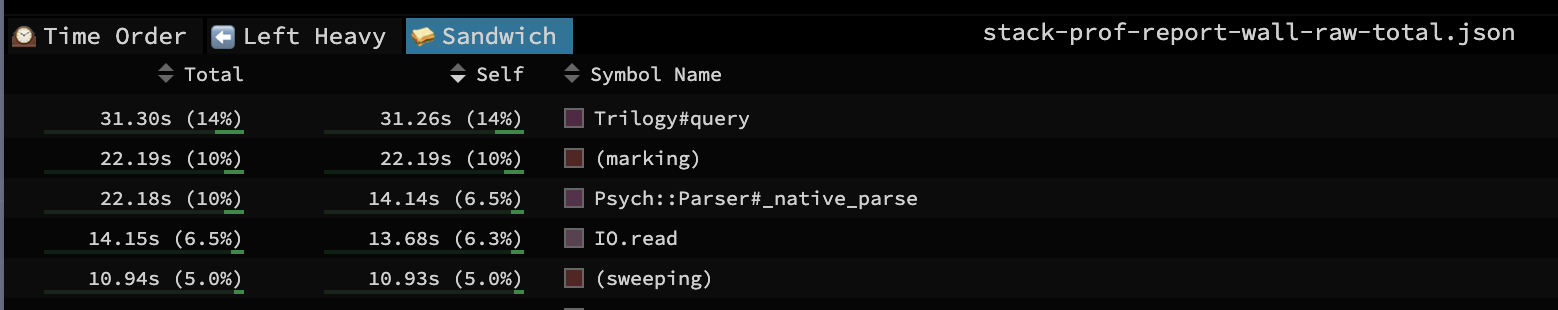
Stackprof report. Speedscope’s Sandwich view
GC is responsible for 15% of time tracked (not “spent”—this is not a wall time, it’s an approximation from samples). Typically, it’s around 5%.
However, while that alone didn’t provide any immediate hints, it was suspicious enough to keep in mind.
I then tried to use TagProf to see which types of specs contribute the most to the total run time and, thus, worth investigating first. It requires running the whole test suite, so it was expected to take quite a time—but wasn’t expected to run forever. The test suite was becoming super slow somewhere after the first 10k examples. The RSpec process started to eat tons of RAM.
At the same time, running sub-suites one by one (bin/rspec spec/graphql, then bin/rspec spec/services, etc.) always finished on time.
Combining all the collected facts I came to the following conclusion: there is some memory leak or bloat putting a lot of stress on GC.
The rest is history. I added a couple of hooks to RSpec to periodically report GC time spent and the final GC time and started to run various combinations of sub-suites (spec/* folders) in the defined order to identify the one causing the trouble:
RSpec.configure do |config|
  # ...

  gc_tracker = 0
  last_gc_time = 0

  config.after(:each) do |ex|
    gc_tracker += 1
    if gc_tracker % 1000 == 0
      time = GC.total_time - last_gc_time
      last_gc_time = GC.total_time

      puts "[GC] Time spent after #{gc_tracker} examples: #{time / 1_000_000}ms (current: #{ex.metadata[:location]}"
    end
  end

  config.after(:suite) do
    time = GC.total_time - last_gc_time
    puts "[GC] Total GC time spent: #{GC.total_time / 1_000_000}ms"
  end
end
Here are some example outputs just to give you an idea what we’re looking for:
$ bin/rspec spec/services spec/controllers spec/graphql

[GC] Time spent after 16000 examples: 3436ms
[GC] Time spent after 18000 examples: 1297ms
[GC] Time spent after 20000 examples: 2188ms
[GC] Time spent after 21702 examples: 4368ms
[GC] Total GC time spent: 66833ms

Finished in 18 minutes 25 seconds (files took 18.67 seconds to load)
21779 examples, 0 failures, 77 pending

$ bin/rspec --exclude-pattern="spec/{controllers,graphql,services}/**/*.rb"

[GC] Time spent after 1000 examples: 4740ms
[GC] Time spent after 2000 examples: 869ms
[GC] Time spent after 3000 examples: 4227ms
[GC] Time spent after 4000 examples: 8735ms
[GC] Time spent after 5000 examples: 23659ms
[GC] Time spent after 6000 examples: 45358ms
[GC] Total GC time spent: 89051ms

Finished in 8 minutes 35 seconds (files took 13.17 seconds to load)
6023 examples, 0 failures, 1 pending
We can see the clear signs of higher GC pressure in the second group.
Bisecting further, I was able to localize the issue—it was the spec/lib folder, the one that contained just 24 spec files and took only 6s to finish!
The only specs that looked suspicious from the side effects perspective were custom RuboCop cop specs. They all had the following preamble:
require "rubocop"
require "rubocop/rspec/support"
require_relative "../../../../../lib/rubocop/cop/custom_cops/some_custom_cop"

RSpec.describe RuboCop::Cop::CustomCops::SomeCustomCop, type: :rubocop do
  include RuboCop::RSpec::ExpectOffense

  # ...
end
A typical cop spec, just like in any RuboCop plugin’s codebase, right? Exactly! This spec follows the best practices for testing pluginified cops.
However, there is a caveat hiding in the rubocop/rspec/support that poisons larger test suites—a global RSpec hook:
# rubocop/rspec/support.rb

RSpec.configure do |config|
  config.include CopHelper
  # ...
end

# rubocop/rspec/cop_helper.rb
module CopHelper
  extend RSpec::SharedContext
  # ...
  before(:all) do
    next if ENV['RUBOCOP_CORE_DEVELOPMENT']

    plugins = Gem.loaded_specs.filter_map do |feature_name, feature_specification|
      feature_name if feature_specification.metadata['default_lint_roller_plugin']
    end
    RuboCop::Plugin.integrate_plugins(RuboCop::Config.new, plugins)
  end
  # ...
end
The hook integrate RuboCop plugins (whatever that means) for every example group in the test suite! And, based on the GC stats, it seems that previously integrated plugins stay in memory forever.
The fix is simple—only pick RuboCop helpers you need:
 require "rubocop"
-require "rubocop/rspec/support"
+require "rubocop/rspec/cop_helper"
+require "rubocop/rspec/expect_offense"

 require_relative "../../../../../lib/rubocop/cop/custom_cops/some_custom_cop"

 RSpec.describe RuboCop::Cop::CustomCops::SomeCustomCop, type: :rubocop do
+  include CopHelper
   include RuboCop::RSpec::ExpectOffense

   # ...
 end
This change alone cut a minute off RSpec time on CI: 4m35s -> 3m30s.
This story inspired us to add a GC mode to our memory profiler. Just run
TEST_MEM_PROF=gc bin/rspecand see the list of examples contributed the most to the GC time as well as the total time spent in GC after the run.
To coverage or not to coverage, or how to coverage?
Another thing that caught our attention was the COVERAGE: "1" environment variable set on CI.
Coverage tracking is well-known for slowing down Ruby tests by 15-20% on average. Disabling it completely could be an easy win (spoiler: that’s what we’ve done in the end). However, coverage change can be a valuable signal when reviewing pull requests, turning it off completely is not always an option.
Luckily, we can have both coverage reports and almost no overhead added by using the recent fatkodima’s contribution to the simplecov gem: oneshot_line mode support. In this mode, only the line of code is tracked only on the first hit, subsequent hits add no overhead to the program being executed. We don’t know how many times each line was executed—but does it really matter?
We’ve updated our Simplecov configuration as follows:
 SimpleCov.start "rails" do
   # ...
-  enable_coverage :branch
+  enable_coverage :oneshot_line
+  primary_coverage :oneshot_line
   # ...
 end
After this change, the RSpec run time went down from 3m30s to 2m30s.
The easiest way to speed up Ruby tests is to turn off coverage tracking or switch to the
oneshot_linemode.
The cost of encryption
Encryption has always been on the list of Top-3 things I check when I start looking for global test downers. This time, however, I found nothing suspicious related to over-encrypting data in the test environment with either Vernier or RubyProf. That could’ve been the end of the story.
Just a few days after we merged the initial test suite improvements (including the aforementioned), the RSpec CI time jumped back to over 3 minutes. Among the recently merged PRs, one stood out: “Encryption: add blind indexes”.
Let me skip the theory about blind indexes and their usefulness, and point you to the blind_index gem default configuration:
Argon2id is used for best security. The default cost parameters are 3 iterations and 4 MB of memory.This configuration is meant for production, not for tests. Especially, not for tests creating tons of records with encrypted attributes. Profiling a sample of the test suite with Vernier confirmed that we’re encrypting too much:

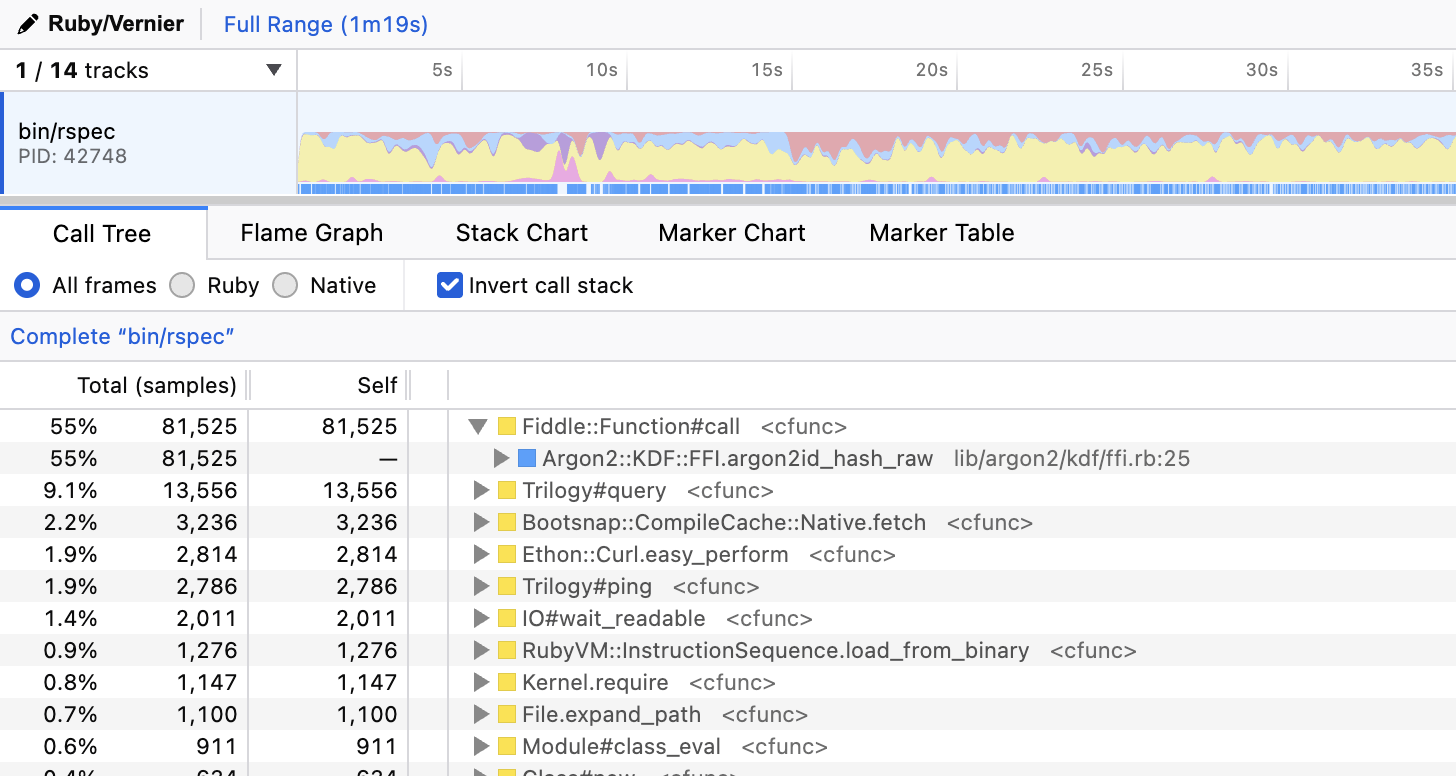
Vernier report showing high usage of FFI via Argon2id
To fix this, we need to pick a weaker encryption algorithm and settings for tests. We’ve ended up with the following configuration (unfortunately, there is no built-in test mode in blind_index):
if Rails.env.test?
  BlindIndex.default_options = {
    algorithm: :pbkdf2_sha256,
    cost: { iterations: 1 }
  }
end
Great! Back to 2m30s.
The most useful metric—tests-per-second
Alright, we’re at the 2m30s mark. What about the remaining 30s?
The next step after eliminating the test-wide bottlenecks is to look for test groups (files) spending most of their time in vain and at the same time contributing significantly to the overall run time. What are these groups? Those with the lowest tests-per-second (TPS) score.
We should also take into account the number of examples in the group. Why? Because our speed-up strategy is to share the setup time between examples, thus, the more examples we have, the bigger the impact of sharing the setup for the total time (and the TPS score).
TestProf 1.6 ships with a built-in TPS (tests-per-second) profiler to identify the test files having the most potential speed-up with minimal refactoring. This profiler can also be used as a runtime linter helping you to keep your vital test suite metrics under control.
Let’s see what TPSProf showed us after we fixed all the global issues:
$ TPS_PROF=20 TPS_PROF_MIN_EXAMPLES=5 bin/rspec
...

[TEST PROF INFO] Total TPS (tests per second): 16.02

Top 20 slowest suites by TPS (tests per second):

Api::V1::GraphqlRestController (./spec/controllers/api/v1/graphql_rest_controller_spec.rb:72) – 6.36 TPS (02:49.770 / 1080, shared setup time: 00:01.426)
Discovery::Ge...cturedMetadata (./spec/services/discovery/generate_structured_metadata_spec.rb:1) – 0.28 TPS (00:43.582 / 12, shared setup time: 00:00.012)
Discovery::GenerateEmbedding (./spec/services/discovery/generate_embedding_spec.rb:1) – 0.51 TPS (00:31.167 / 16, shared setup time: 00:00.012)
Types::Output::UserType (./spec/graphql/types/output/user_type_spec.rb:1) – 5.91 TPS (00:24.853 / 147, shared setup time: 00:00.344)
FraudManager:...sinessReceipts (./spec/services/fraud_manager/fetch_business_receipts_spec.rb:1) – 1.09 TPS (00:16.480 / 18, shared setup time: 00:16.340)
Types::Output::CompanyType (./spec/graphql/types/output/company_type_spec.rb:1) – 5.71 TPS (00:18.044 / 103, shared setup time: 00:01.177)
Clickhouse::Migration (./spec/services/clickhouse/migration_spec.rb:3) – 2.14 TPS (00:14.517 / 31, shared setup time: 00:00.014)
... (and more)
You can see that the resulting list is not sorted by TPS. Why? Because we sort it by the potential savings (that are calculated based on the overall time and the number of examples). For example, the graphql_rest_controller_spec file has a TPS of ~6 but the total time is almost 3 minutes and it has ~1k examples! Assuming that we can achieve a TPS of, say, 20, we could save ~2min—not so bad, right?
So, we fixed a handful of files listed above and the overall CI RSpec time decreased from 2min30s down to 2min.
Now, let me share what we found in some of those files. Yeah, it was not just let -> let_it_be refactoring. All fast tests are alike; each slow test is slow in its own way.
The already mentioned graphql_rest_controller_spec is a high-level integration test that verifies that a REST-to-GraphQL proxy works as expected by trying to hit every possible endpoint (that’s why we have ~1k examples). There is (almost) no data creation: we stub GraphQL resolvers to return fake data, because all we need is a correct shape of the response. And here is what we had in the before block for that:
before do
  # Mock union resolve_type to return the first possible type
  GraphQL::Schema::Union.descendants.filter { |k| k.respond_to?(:resolve_type) }.each do |klass|
    allow(klass).to receive(:resolve_type) do |*_args|
      klass.possible_types.first
    end
  end

  # Mock interface resolve_type to return the first orphan type
  ObjectSpace.each_object(Module).select { |m| m.is_a?(Module) && !m.is_a?(Class) && m.ancestors.include?(Types::BaseInterface) && m != Types::BaseInterface }.each do |klass|
    next unless klass.respond_to?(:orphan_types) && klass.orphan_types.present?

    allow(klass).to receive(:resolve_type) do |*_args|
      klass.orphan_types.first
    end
  end
end

# ...
Iterating over descendants, accessing ObjectSpace and filtering all the modules we have in the Ruby VM (we had over 50k!) is not fast, trust me. This is a necessary evil for having a single black-box-like setup that doesn’t require updates every time a new GraphQL type is added. But can we do better? Sure, we can patch everything once and for all:
before(:all) do
  $graphql_rest_faked = true
  resolve_type_patch = Module.new do
    def resolve_type(*) = $graphql_rest_faked ? possible_types.first : super
  end
  # Mock union resolve_type to return the first possible type
  GraphQL::Schema::Union.descendants.filter { |k| k.respond_to?(:resolve_type) }.each do |klass|
    klass.singleton_class.prepend(resolve_type_patch)
  end

  resolve_orphan_types_patch = Module.new do
    def resolve_type(*) = $graphql_rest_faked ? orphan_types.first : super
  end

  # Mock interface resolve_type to return the first orphan type
  ObjectSpace.each_object(Module).select { |m| m.is_a?(Module) && !m.is_a?(Class) && m.ancestors.include?(Types::BaseInterface) && m != Types::BaseInterface }.each do |klass|
    next unless klass.respond_to?(:orphan_types) && klass.orphan_types.present?

    klass.singleton_class.prepend(resolve_orphan_types_patch)
  end
end

after(:all) do
  $graphql_rest_faked = false
end
After that change, the TPS increased from 6 to 27 (“on my machine”) and the run time decreased from 2m50s to 40s.
The discovery/generate_X specs had the lowest TPS (~0.3). Factory and setup time analysis didn’t show anything. What’s going on there? Let’s try RubyProf this time:
$ SAMPLE=2 TEST_RUBY_PROF=1 bin/rspec ./spec/services/discovery/generate_embedding_spec.rb
...

Finished in 7.01 seconds (files took 25.42 seconds to load)
2 examples, 0 failures
[TEST PROF INFO] RubyProf report generated: tmp/test_prof/ruby-prof-report-flat-wall-total.txt

$ more tmp/test_prof/ruby-prof-report-flat-wall-total.txt

 %self      total      self      wait     child     calls  name                           location
 20.04      6.002     6.002     0.000     0.000        2   Kernel#sleep
  4.60      2.551     1.377     0.000     1.174     9984   <Module::Bootsnap::CompileCache::Native>#fetch
  2.84      0.852     0.852     0.000     0.000   131068   String#split
  ...
Wait, are you sleeping? A quick look at the codebase showed that we have a retry mechanism in the services under tests with an exponential backoff, and we have many tests verifying various retry conditions! And we use production-level settings for the backoff: that’s where we sleep.
Ideally, I would extract retry strategy into a dedicated abstraction and test separately with no or a bit of sleeping and test that it’s used in the services. However, when working on a codebase you don’t own, it’s better to avoid structural refactoring and only introduce incremental changes.
In this case, I’ve made retry parameters configurable and updated the specs as follows:
 RSpec.describe Discovery::GenerateEmbedding, type: :service do
+  subject { described_class.call(access_pass: access_pass, metadata: metadata, retry_delay: 0.01) }
-  subject { described_class.call(access_pass: access_pass, metadata: metadata) }
One more example before we wrap up—spec/services/fraud_manager/fetch_business_receipts_spec.rb. The TPSProf output shows that most of the time is spend during the shared setup phase (e.g., before_all or let_it_be): 1.09 TPS (00:16.480 / 18, shared setup time: 00:16.340). Sharing setup time is meant to speed up tests, not make them slower. What happened here? Well…
context "when limit exceeds MAX_LIMIT" do
  let(:filters) { { limit: 1000 } }

  before_all do
    # Need 500+ records to assert the service caps at MAX_LIMIT (500)
    create_list(:receipt, 600, :with_order_confirmation_data, user:)
  end

  # ...
end
Testing boundary conditions in tests by creating the same amount of data required to hit them in production is rarely a good idea. Like in the previous example, a fix would be to make the limit configurable (2 is enough for tests) and do not over-create records in tests.
So far, we’ve been talking only about finding and fixing existing slow tests and misconfigured test environments. What about preventing them from re-appearing in the future? Let’s take a sneak peek into what may come next in TestProf Digest.
In the next issues
A new TestProf release (v1.6.0) isn’t the only outcome from our recent gig at Whop. As a part of our work there, we were also responsible for enhancing Whop’s AI-coding experience and updating their comprehensive set of tools with test-specific agents and skills.
These skills are used to help LLMs generate efficient specs right away and the agents are used to review PRs and nudge you to “Replace let with let_it_be” or “Don’t create 50 records to test pagination, add a ?page_size=2 parameters” or “Using rubocop/rspec/support is prohibited, here is how to structure the spec…“.
It’s too early to say if AI skills and agents are enough to keep tests reasonably fast—let’s give them some time to show off.
We’ll be back with more updates on TestProf, its skills and features and new stories soon. Stay tuned!