Debug AI fast with this open source library to visualize agent traces


AI agents fail silently, loop endlessly, skip steps, and give wrong answers. If you’re debugging them by parsing JSON logs at midnight, you’re suffering needlessly. At Evil Martians, we’ve built enough AI agents to intimately know this pain: 4-hour debugging sessions hunting through nested JSON for a loop that should be obvious. When Quotient AI, a Boston startup building production agent reliability tools, hit the same wall, we partnered with them to solve it.
Martian project team

Gleb Stroganov
Product Designer

Yuri Mikhin
Frontend Engineer

Ivan Eltsov
Frontend Engineer

Kirill Yakovenko
Account Manager


We built AgentPrism, an open source React component library that cuts debugging time from hours to seconds. Quotient uses it in production, and now you can, too.
The tooling problem
Here’s a scenario: Deanna from Quotient AI is an AI Researcher who isn’t new to debugging agents. She’s evaluating a new multi-agent system where one agent plans and others execute. Somewhere in the chain, a sub-agent keeps calling the wrong tool. The trace should explain everything: the messages, tool calls, and retries.
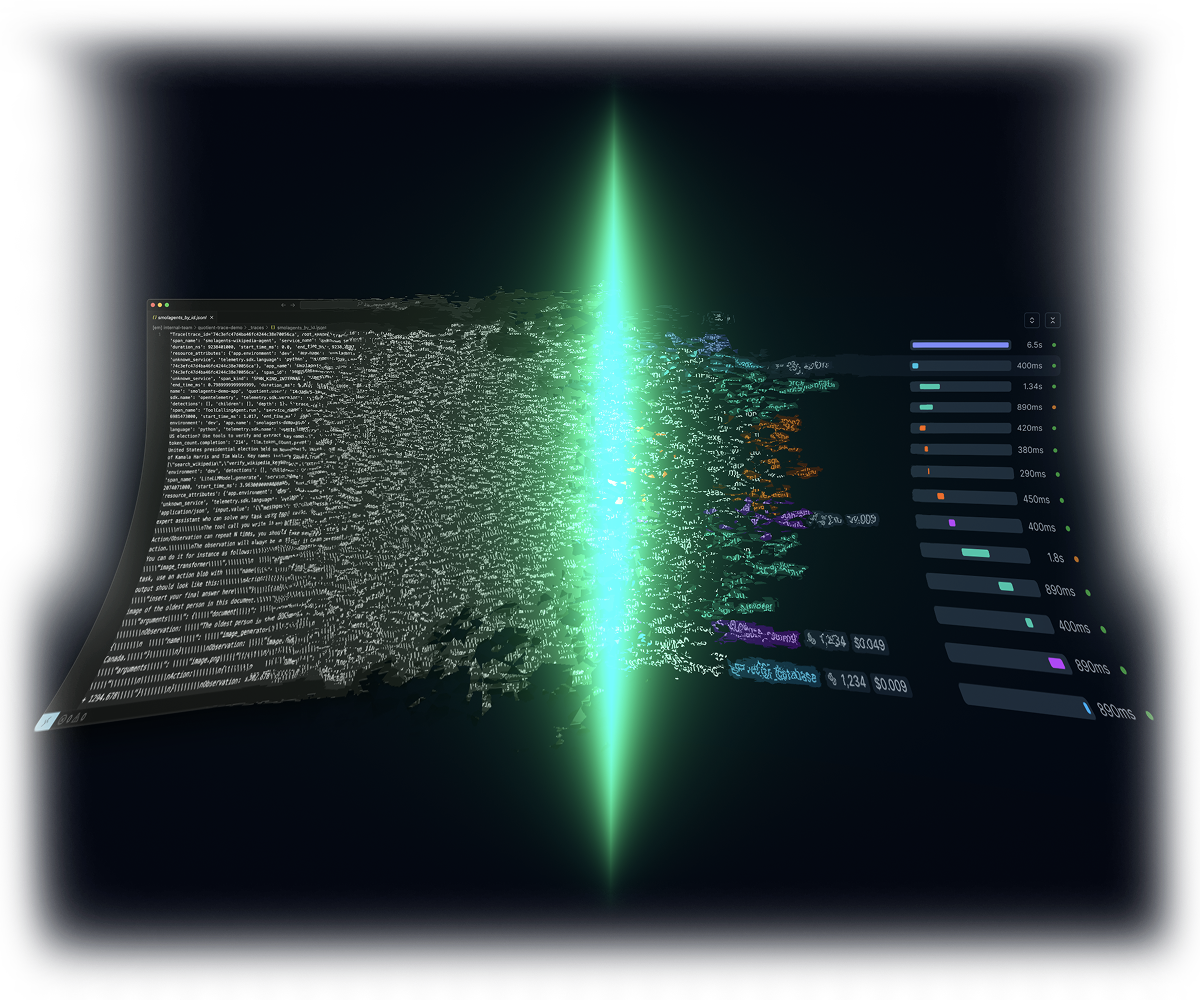
The only problem? The answer is buried within a terrible wall of JSON logs, and it’s impossible to see the flow.
This isn’t a one-off situation; it’s something that’s happening to AI developers every day. AI solutions (like LangChain, Mastra, OpenAI Agents, AI SDK, and Quotient) are pressured from enterprise customers to provide bullet-proof debugging and monitoring.
But observability for LLM-driven agents hasn’t caught up yet. Current pains:
- Manual log-scrubbing stretches incidents from minutes to hours
- Redundant model calls and mis-sequenced API hits burn $500–2,000 per failure
- Unexplained agent behavior erodes trust with users and regulators
Of course, we didn’t just see this, we also experienced this pain ourselves, and we knew we couldn’t be alone. The struggle was real!
Something clicks
We introduced OpenTelemetry observation and started tracking all steps systematically. Suddenly, we saw those loops forming, understood why they were happening, and could fix them in minutes.
With that, 4 hours of manual JSON parsing became 30 seconds of visual inspection!

Hire Evil Martians
AgentPrism is another step towards agent reliability. Let’s put AI to work for your product.
The insight: human brains excel at visual pattern recognition. This means that loops invisible in JSON become glaringly clear when made visual. Thus, fixing cost spikes that require manual calculation becomes essentially instant.
We researched almost all existing observability solutions and tried them ourselves. Great tools, but we realized they solve different parts of the same problem. We decided to combine the best in one place.
Instead of choosing between multiple complex tools, we’re bringing the essential features together: LLM insights + trace structure + visualization = drop-in React components
So, we built React components that transform raw OpenTelemetry trace data into interactive visualizations.
A look at AgentPrism
The result? Engineers get enterprise-grade observability without leaving their IDE or dealing with complex dashboards.
We conducted a round of design-engineering exploration and selected the best 4 out of 12 components. We chose these 4 because they directly address the core debugging workflow.
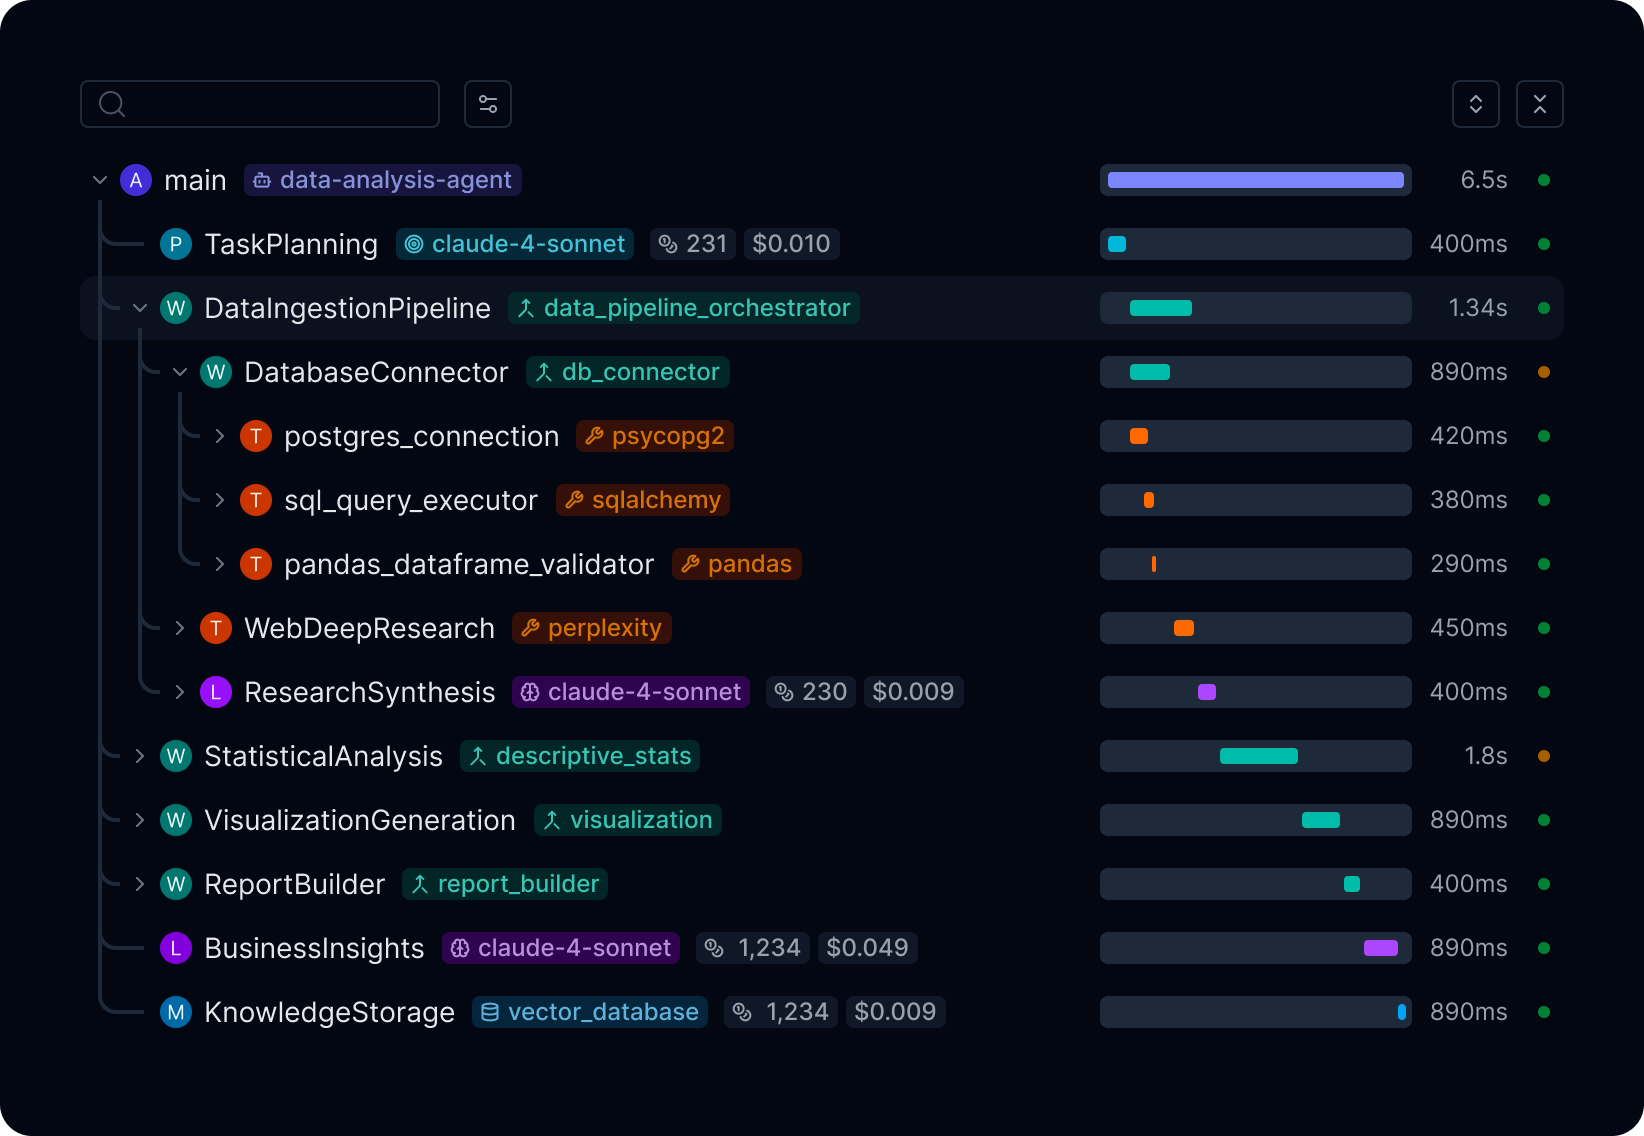
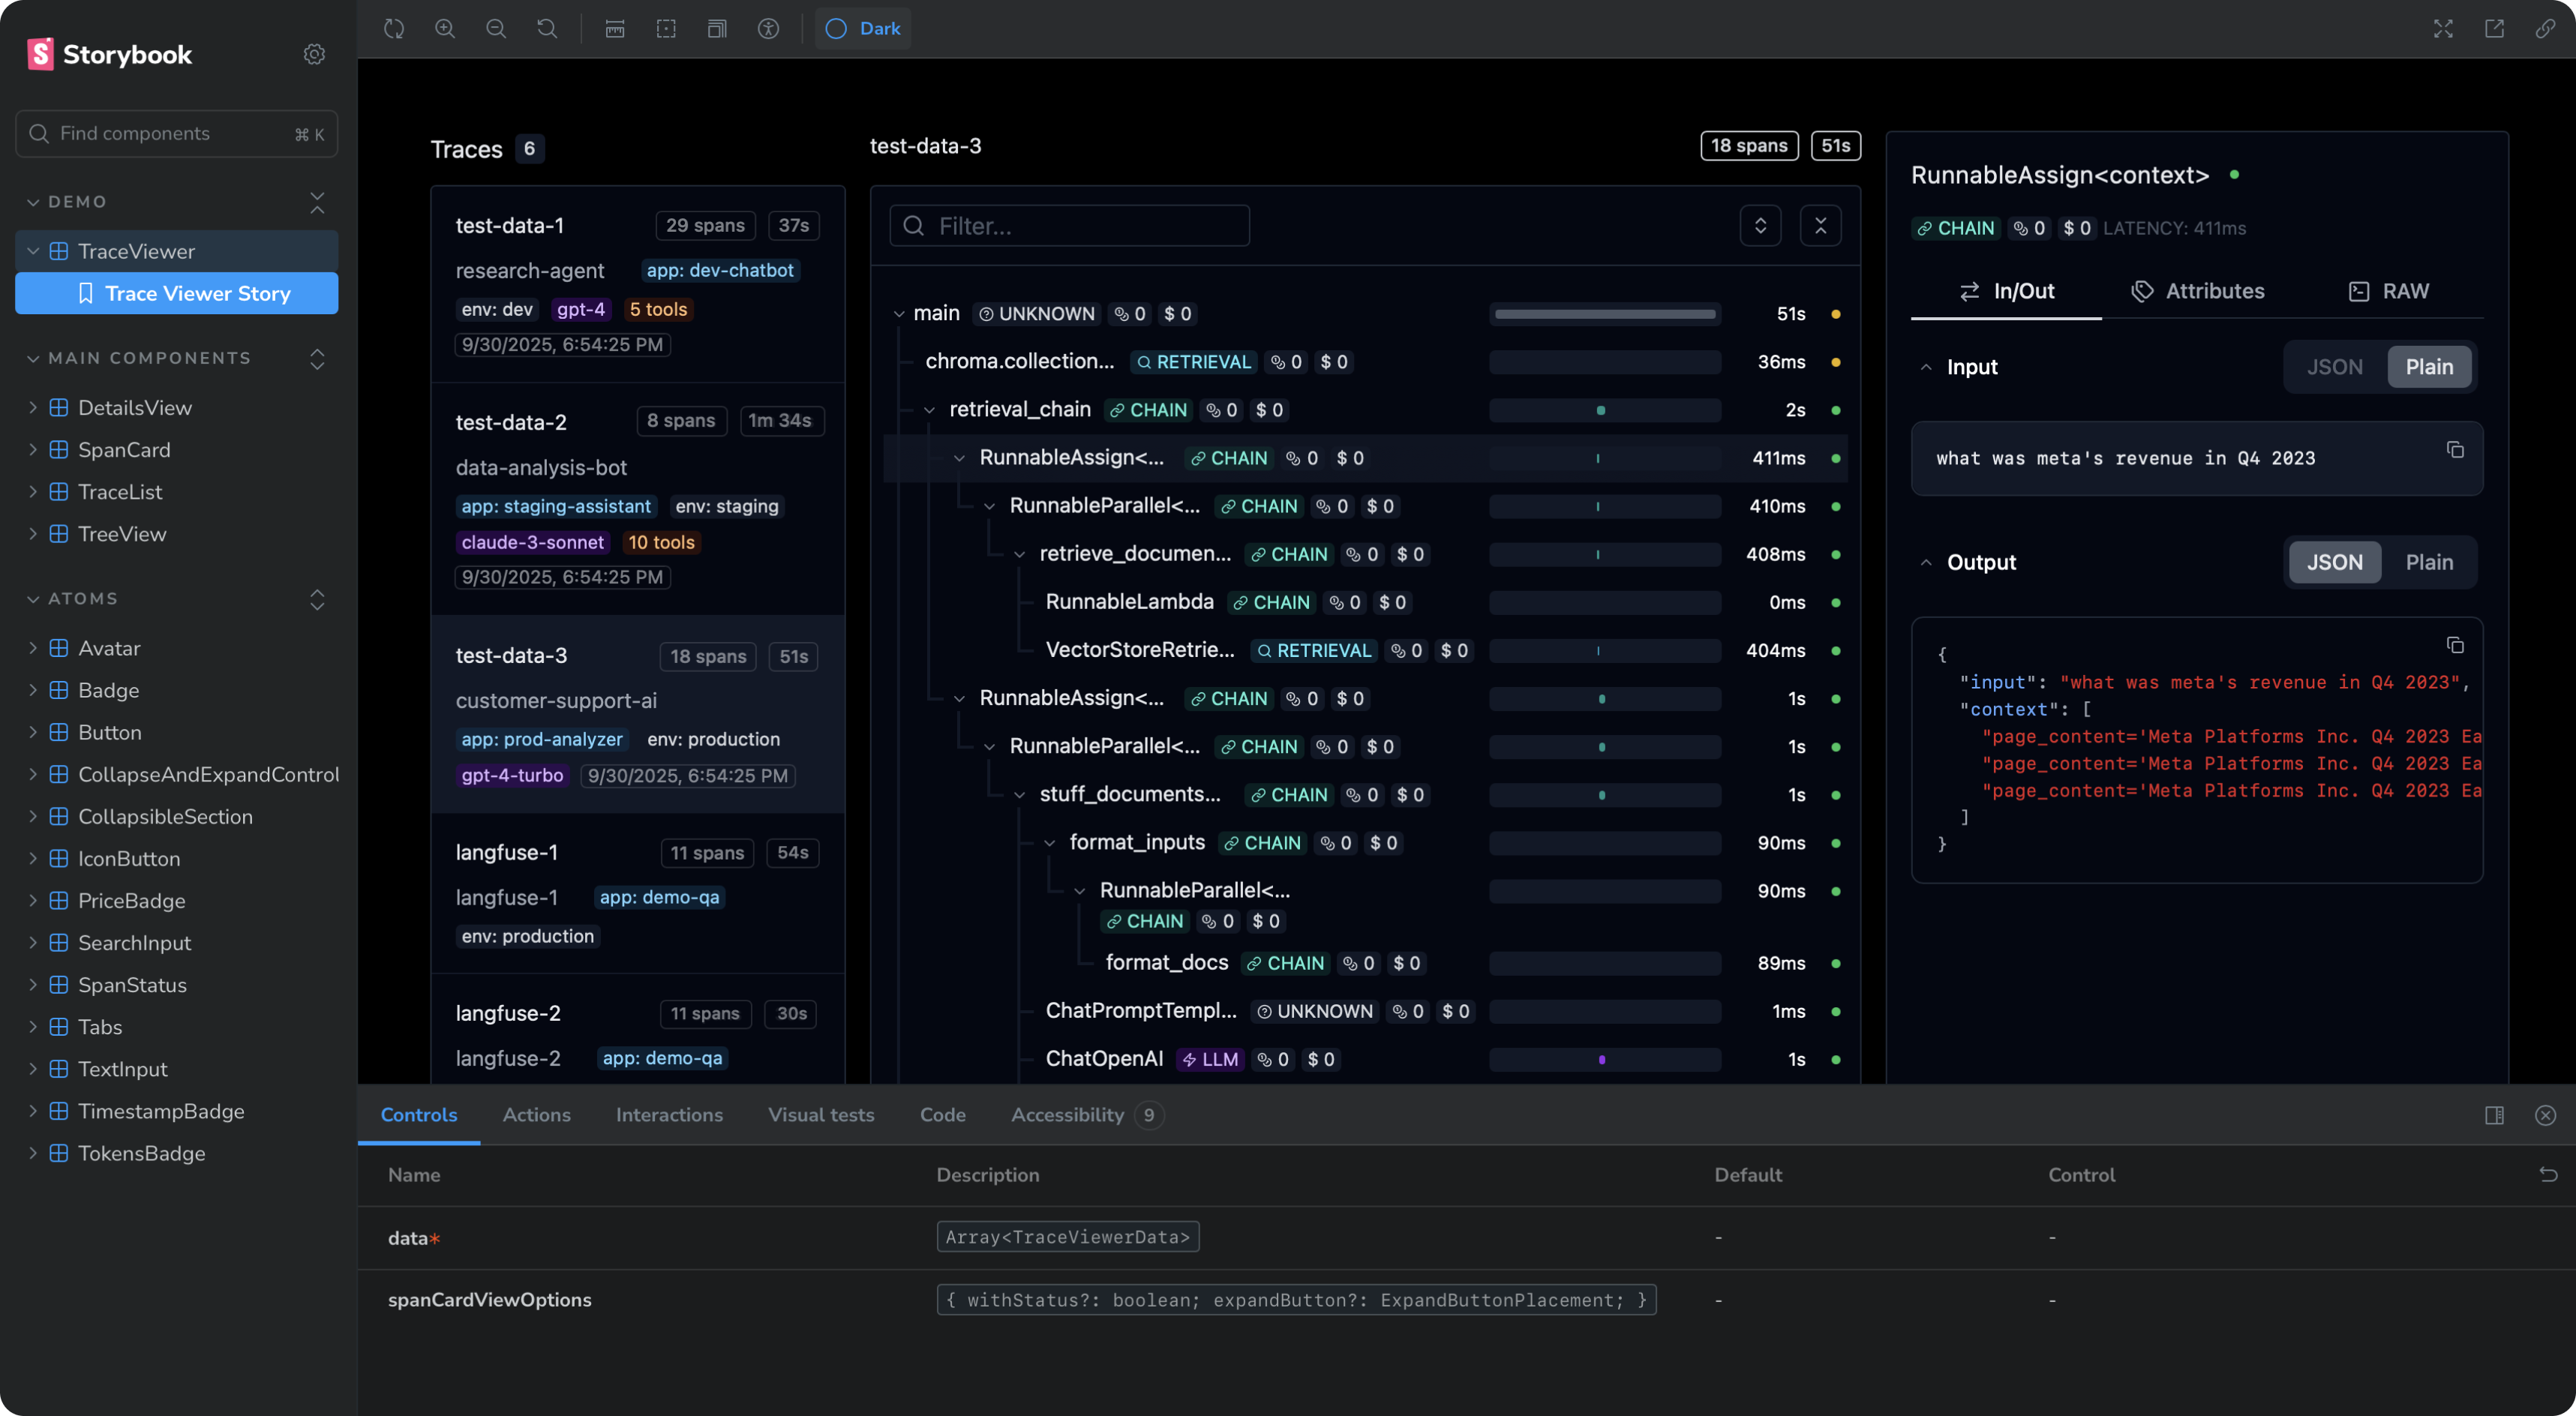
Tree View displays the hierarchical trace structure
- Shows parent-child relationships between agent steps
- Red highlighting for problematic patterns
- Collapsed summary for repetitive sequences
We found that engineers wanted hierarchy above all and Tree View was the most effective since progressive disclosure keeps deep structures navigable and minimizes on-screen noise and navigation cost. (Tree View appears on the left in the image just below.)
Timeline View shows a Gantt-style execution flow
Timeline View quickly points to where time and money are being wasted.
- Reveals concurrency issues and bottlenecks
- Color-coded status indicators (green = success, red = error, yellow = warning)
- Real-time cost accumulation with dollar amounts

Tree View on the left, Timeline on the right
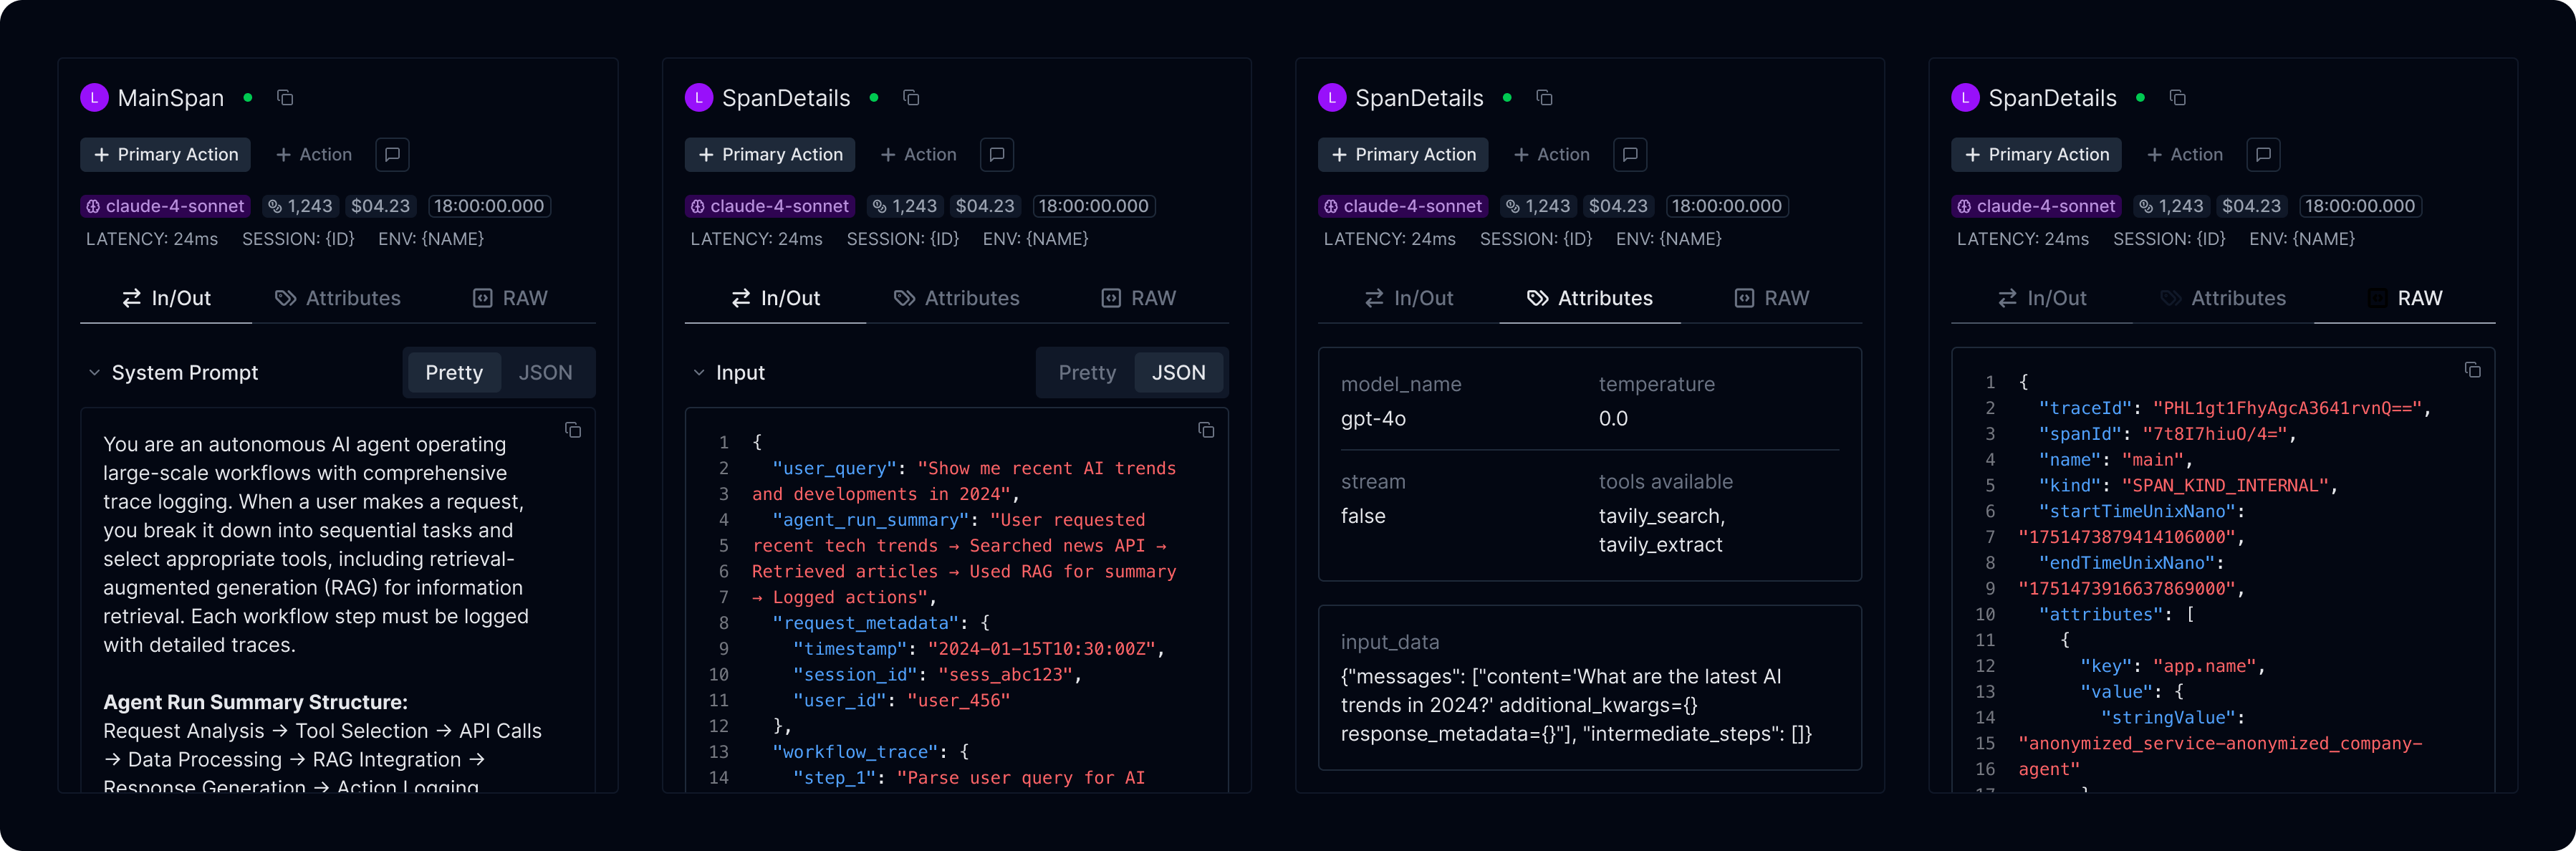
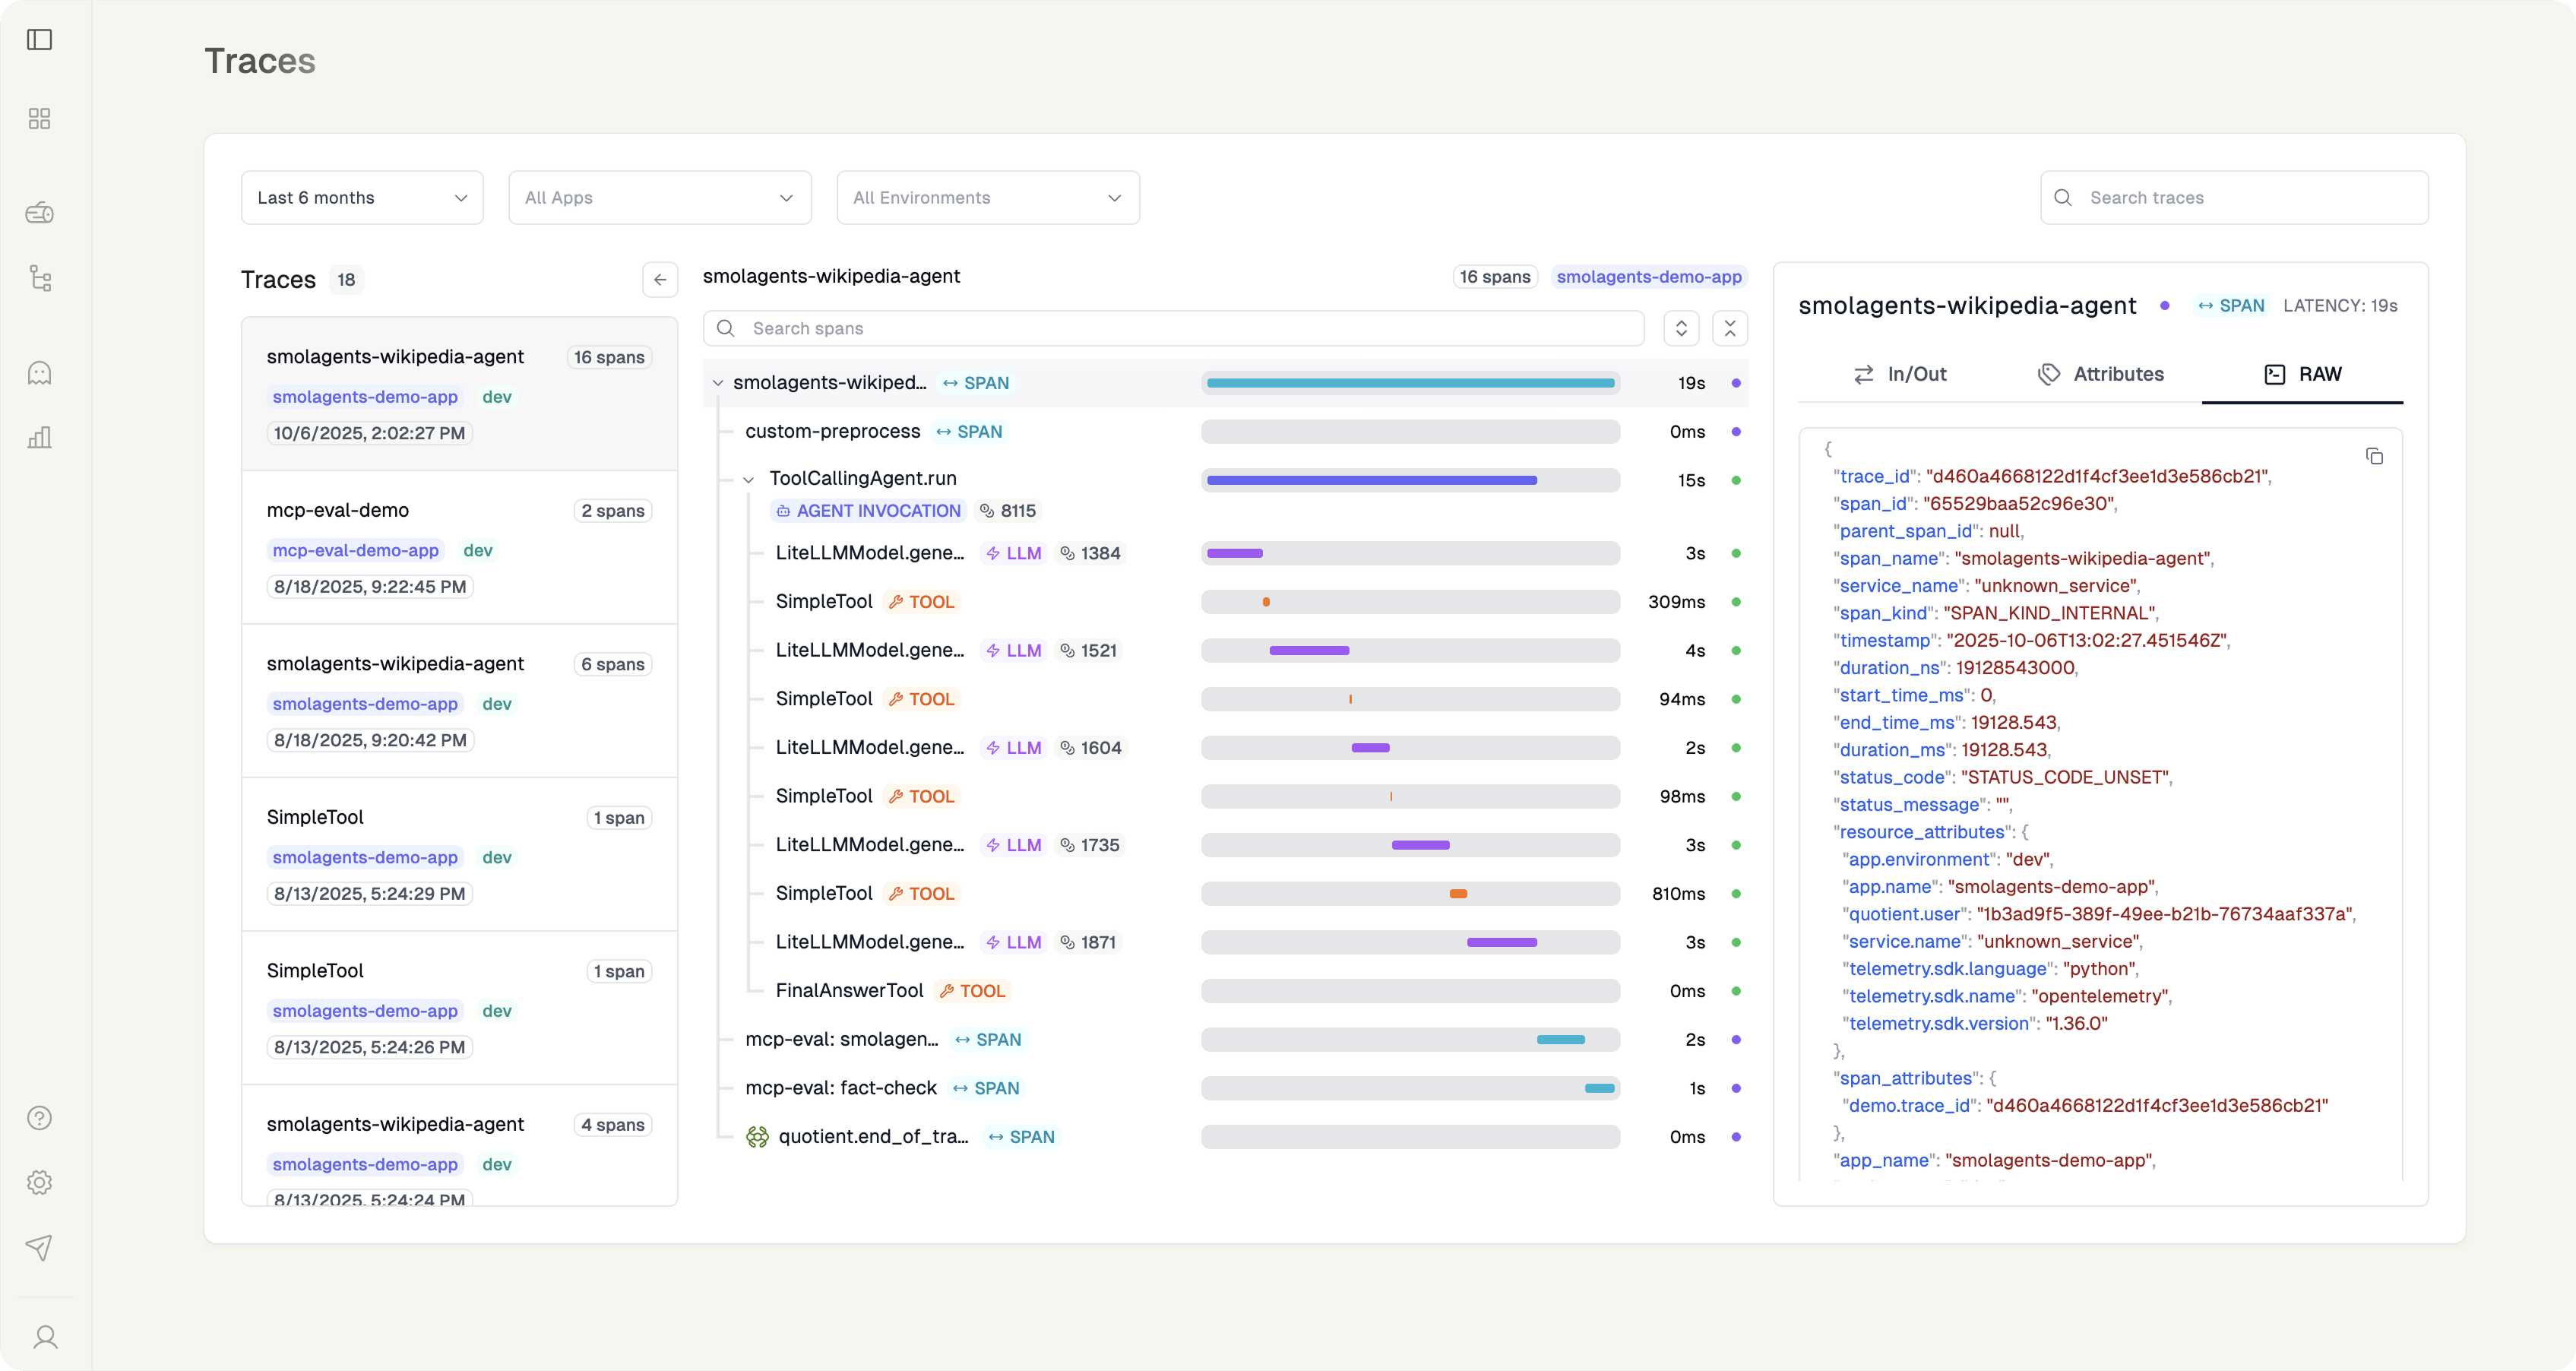
The Details Panel displays a compressed span of information
This panel gives engineers necessary context, without overwhelming detail.
- Input/output data for each step
- Cost breakdown and performance metrics
- All relevant attributes in one view

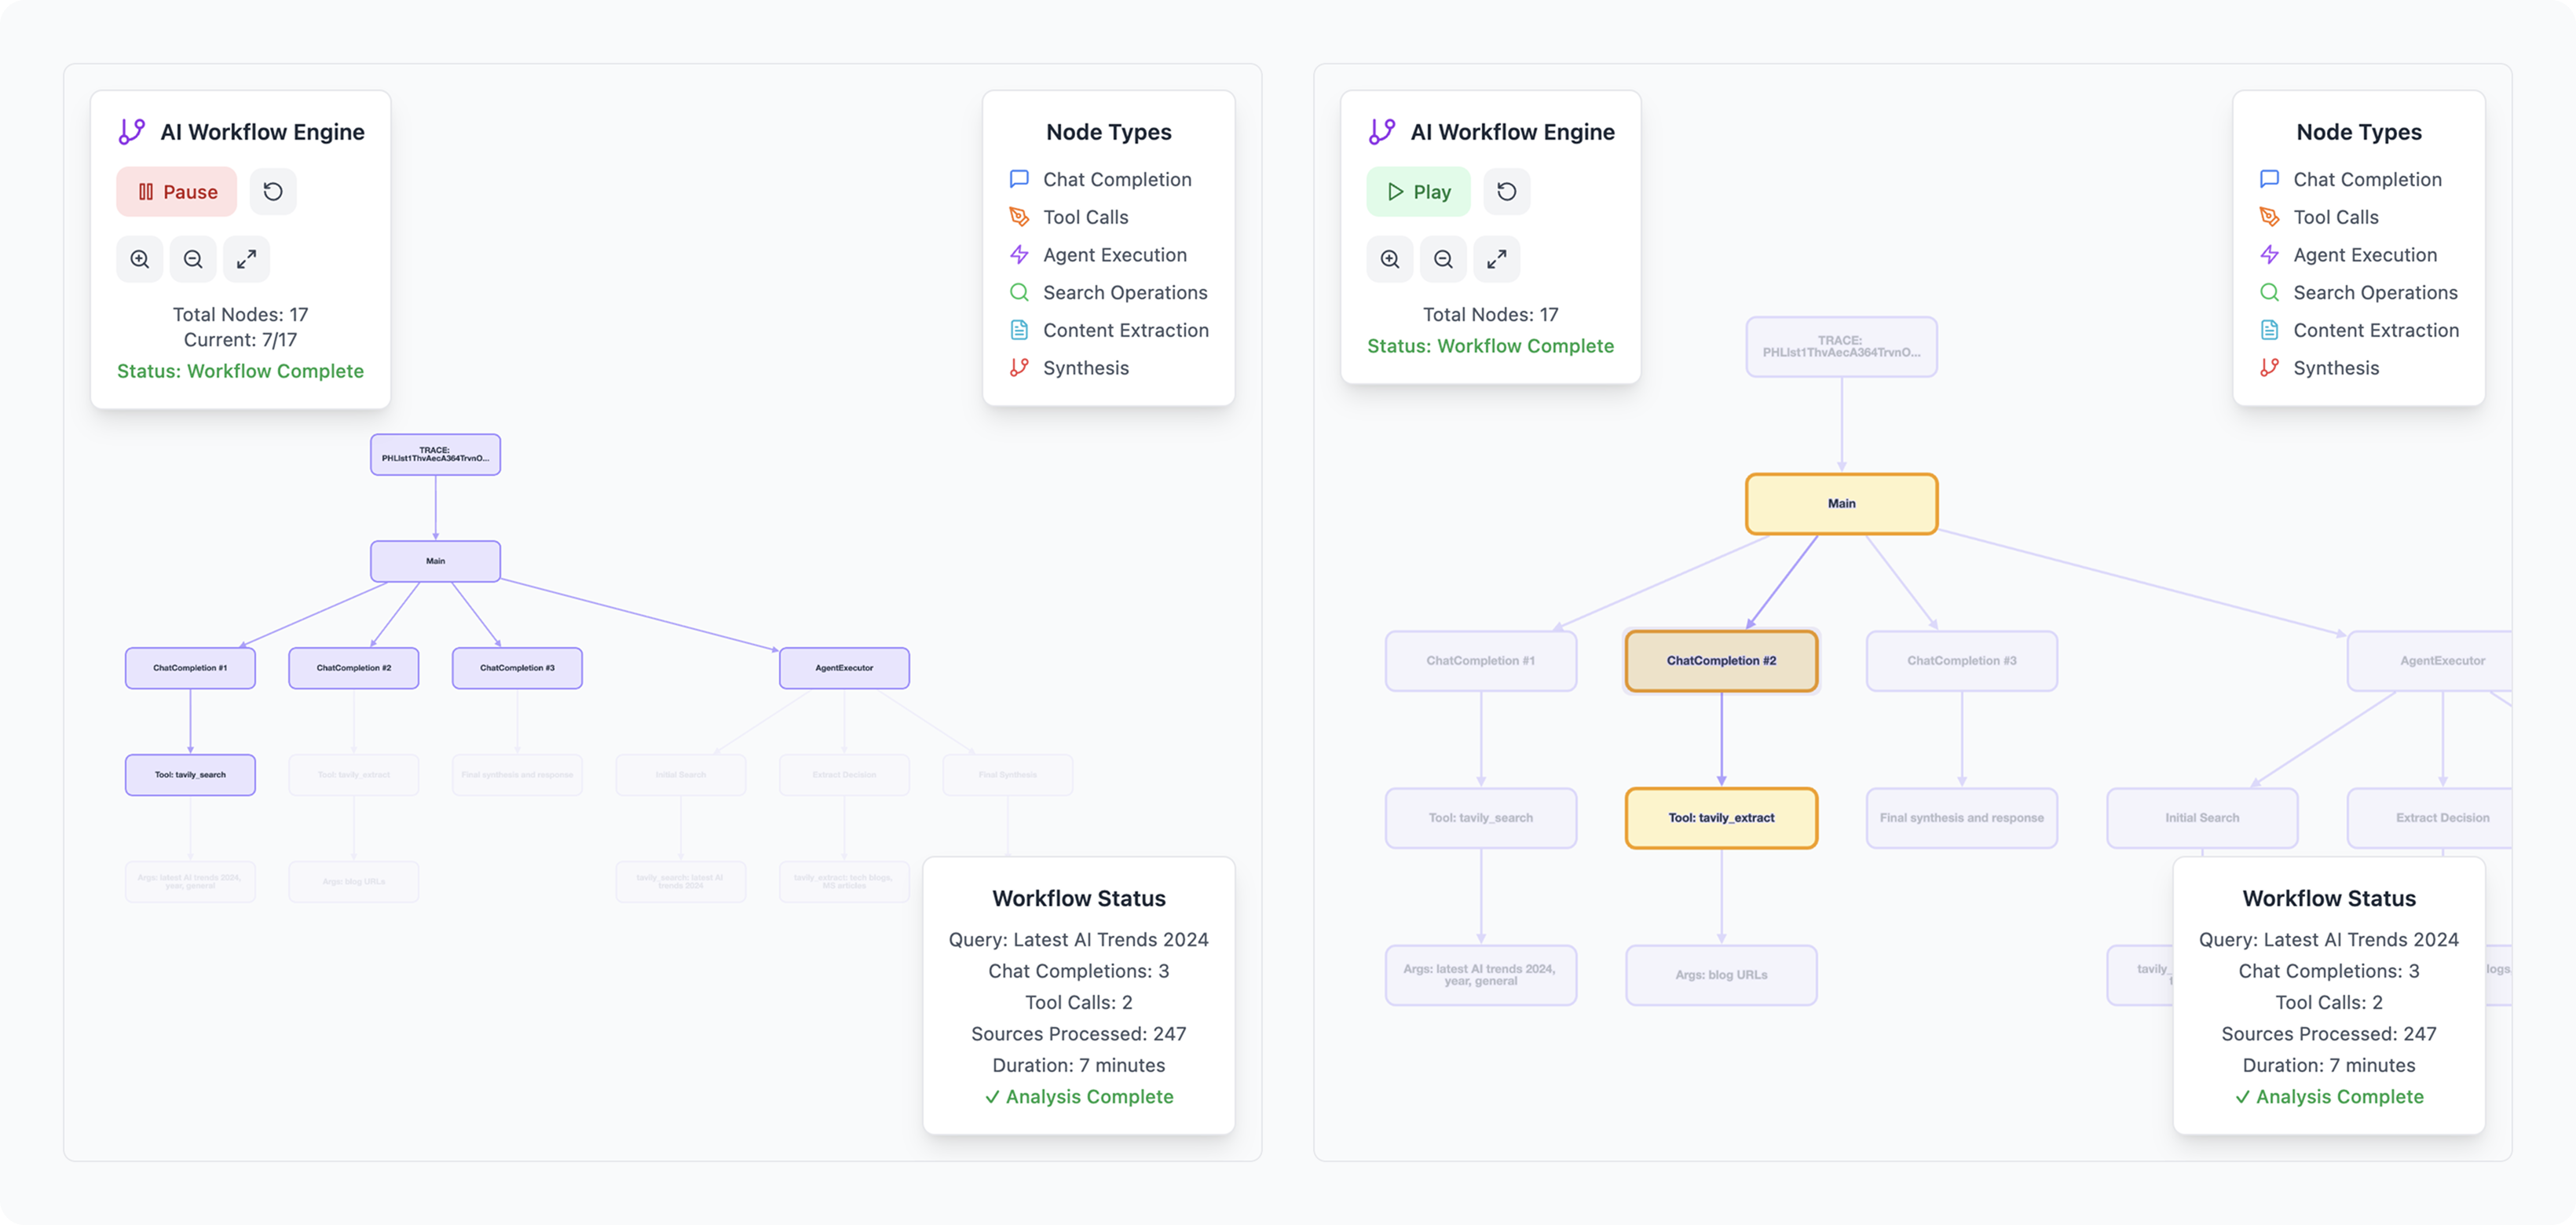
The Sequence Diagram shows a step-by-step replay
The Sequence Diagram is ideal for onboarding users and introducing the concept of agent traces. It’s also good for debugging complex flows.
Additionally, when you play/pause an agent run, you can observe how the agent is working in real-time.
- Perfect for understanding decision chains
- Visual flow of prompts and responses
- Easy identification of circular logic

The impact for real users
Every extra click outside my IDE kills context. Now I can see the loop pattern immediately—no more parsing JSON for hours.

Freddie Vargus
Co-founder & CTO, Quotient AI
The visual timeline showed me exactly where users were dropping off. What took 4 hours before now takes 10 minutes.

Julia Neagu
Co-founder & CEO, Quotient AI

AgentPrism: technical implementation
- Monorepo: pnpm + TypeScript + React + Vite. Core is split for clean boundaries and distribution.
- UI (TreeView, SpanCard): accessible (Radix/ARIA), strongly typed, themeable, layout-flexible.
- Data (services): converts OTLP/OpenTelemetry into a compact UI schema; local types aligned to the spec.
- Distribution: UI components as copyable source (shadcn-style); Data converters as npm packages.
- Integration: import components + converter; render traces in minutes without external dashboards.

Get started now
We’re open sourcing this because the entire AI ecosystem needs better debugging tools.
Our components work with any OpenTelemetry-compatible data, ensuring broad compatibility without vendor lock-in. The value of AgentPrism is clear:
- Instant pattern recognition vs. sequential analysis
- 80% reduction in debugging time and 60% reduction in memory usage
- Real-time cost monitoring and alerts
- No external dashboard context switching
- Industry-standard OpenTelemetry foundation
- Drop-in simplicity vs. complex enterprise tools
- IDE-native experience vs. external dashboards
AI founders will love AgentPrism because it allows shipping reliable products 5× faster with visual debugging workflows.
 Storybook
Developers will love AgentPrism because these are drop-in React components that integrate with your existing stack.
 AgentPrism on GitHub
Product designers will love AgentPrism because they can pick up these battle-tested components instead of running months of UI exploration.
 Figma Kit
We’re looking for more design partners to validate our approach and shape future features. Here are some ways to get involved:
- Let’s talk about how you can leverage this tool for your startup
- Join our early adopter program and get priority access to new features
- Contribute to the open source project and help shape the ecosystem