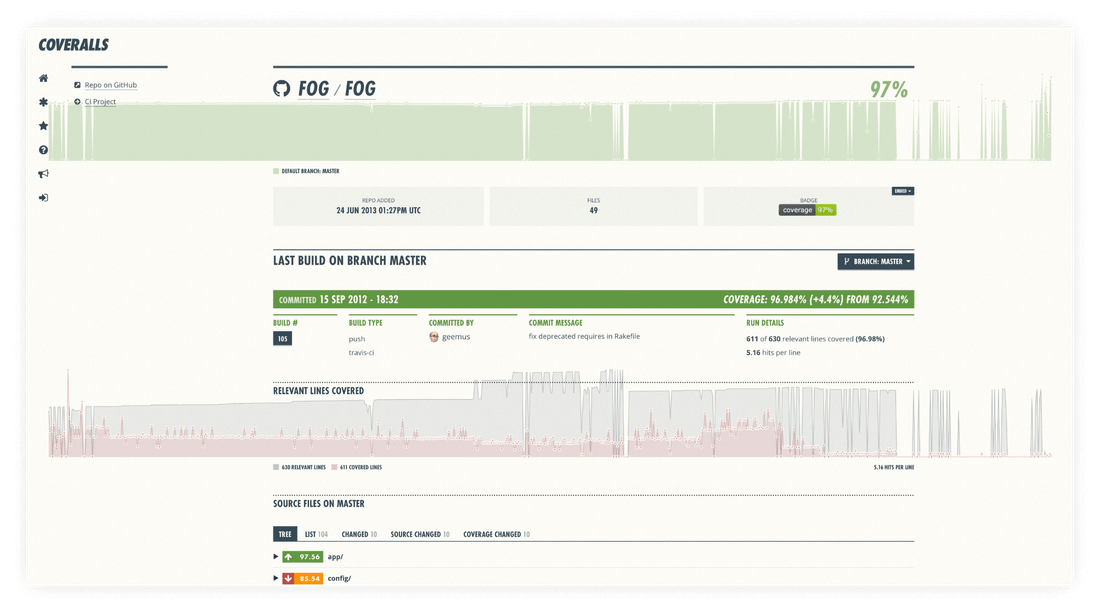
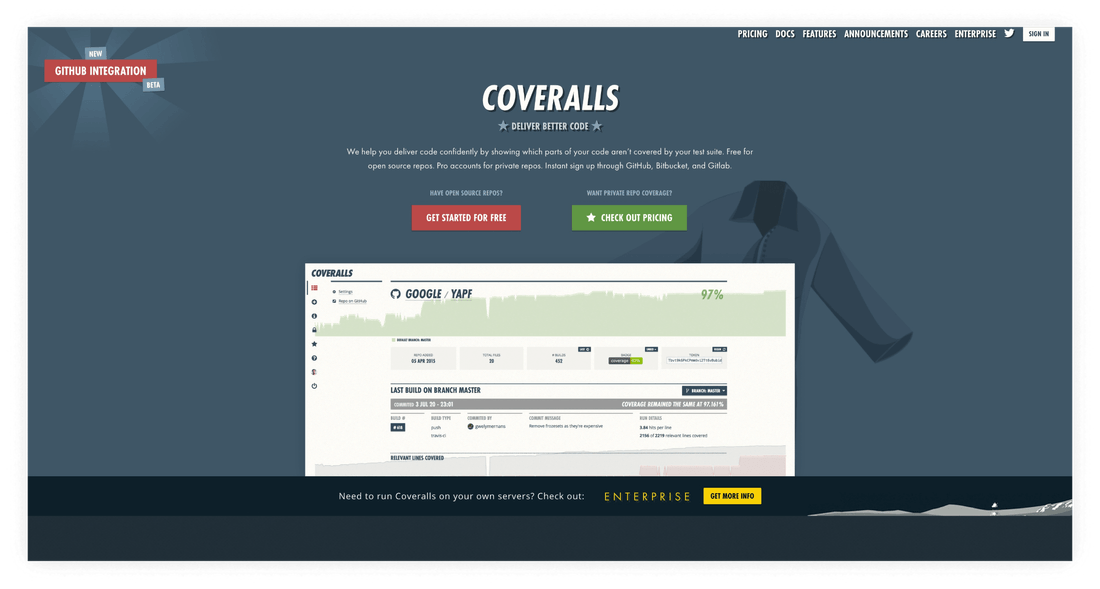
Coveralls integrates with GitHub, GitLab, and Bitbucket via modern CI solutions like GitHub Actions, CircleCI, and many more, and displays the test coverage percentage status for every push and commit. Engineers can trace changes and trends during the development cycle thanks to this analysis and historical data.
Optimizing backend
The project team planned new feature releases and expected a surge of users. They were looking for a reliable development partner to support their expansion goals and turned to the Evil Martians backend team to speed up their Rails application, optimize it, and make it more maintainable and scalable. First, we increased the app’s transparency and manageability by implementing a monitoring system based on our own open source solution, Yabeda—in combination with Grafana and Prometheus.
The team got new, more complete performance metrics and detailed dashboards showing application health, and we then shaped and ran a set of optimizations to speed up the application and increase stability and fault tolerance. This work included Ruby, Rails, and all related component updates, refactoring, infrastructure optimization, and database partitioning and caching to prevent any more potential bloating.
In addition, we worked hard to overcome a challenge that high-load dev tools face pretty regularly: the “fair” prioritization of pending tasks between paying customers, depending on their billing plan. (Apps don’t often solve this, and customers with more expensive plans have to wait with the others as the service itself starts to slow down.)
We solved the challenge of “fair” queues in Sidekiq by setting quotas for each client’s tasks: their first tasks are completed quickly as usual, but if a particular client continues to add tasks within a short window of time, we start to deprioritize them. Thus, customers receive a responsive service, and those who have many tasks have the opportunity to switch to a more suitable plan. Along the way, we managed to reduce the number of processes for workers in Sidekiq 5 times for the same workloads.
Delivering features
In parallel, we were able to participate in product development: our designers and frontend engineers helped optimize the UX/UI, adding some new elements and product features.
For instance, we helped implement a universal integration mechanism—using their own coverage-reporter CLI tool built on Crystal. This cross-platform tool parses coverage files and sends the parsed data to Coveralls. It was designed to eliminate all the imperfections of selective integrations and standardize (and, therefore, simplify) communication between end users and the service. We also added 6 new coverage formats support (besides the existing LCOV format).
Another enterprise feature we helped build is Carryforward Flags. This mechanism allows sending partial coverage and using previous builds to calculate overall metrics for the entire project. This feature is a must-have for mono repositories or projects with component-based architecture where tests are run only for changed components (such as Rails monoliths built from engines).
Design
In one of our collaborative “blamestorming sessions,” where we explored the problem of too many queues accumulated on the server, we tried to figure out the causes behind it. We investigated the network load data in the Grafana dashboard and discovered that large numbers of requests and builds load the system and increase execution time. We suggested a new product feature—a performance dashboard to show users how their builds are being executed and why it takes different times, complete with detailed graphs. This was intended to tell users the exact moment they have too many queues and how they can optimize this.
Evil Martians designed the entire flow (charts, tables with builds, and additional navigation) using actual performance data from several real customers selected by the Coveralls team. (And later, the product was built by our backend and frontend teams.)

We also helped design other features, like monorepo support, and we brushed up key elements like general blocks for all pages, and took part in the process of improving the UX flow between service pages.
Helping the Coveralls marketing team
In this project, the designers also worked closely with the Coveralls marketing team: they presented and explained new features and price plans to users.
Together, we went through every stage of the communication strategy and thought out the next steps and necessary assets. For example, we prepared a newsletter template and segmented the newsletter audience, worked on banners on particular topics for social networks and letter cover pictures, and designed the company’s annual report. We created separate landing pages for each email distribution—and to keep the engineering team focused, Evil Martians did it on our own, coding and deploying the pages.

In the process, we set up analytics together and made a smooth transition to Google Analytics 4, which gives more insights and allows building reports based on event systems. We used this to get statistics on newsletters and landing page views, funnel reports, and tracking user paths. This was done to create more relevant content and design for communicating with their users.
Currently, the Martians team is working on the core app logic and infrastructure optimization and the development of a new feature that can help the Coveralls tech support team to use an AI-based assistant for their tasks.


