Figma plugin magic tricks: mixing colors with SVG and Canvas API


During development, one may encounter a problem where the obvious solution (or even obvious solution B, or C) doesn’t work. This happened to me while making Polychrom, our new UI-text readability plugin. In our case, I learned from the roadblock, leveraged a problem-solving technique to entirely change my perspective on the problem, engineered an “a-ha” moment, and then blasted onward to a solution.
Polychrom is our free Figma plugin allowing for more precise control over UI text readability. It involves automatically detecting contrast levels between selected items and their background layers using the APCA method. To ensure users get contrast values that are perfect and readable, it allows them to: easily adjust the text color based on the background; adjust the background color based on the text; work with multiple objects; and deal with opacities and blend modes.
This article deals with that final scenario, and is about implementing the blending of color fills inside the plugin. How did we pull that off? Read on.
Identifying the task
Initially, Polychrom just worked with simple user scenarios (for example, when a text object with only one opaque fill is selected and lies against the background of another object with only one opaque fill). This was part of our development strategy—we’d implement something simple first to define the major milestones, and then gradually build up the plugin’s capabilities from there.
So, later, once we released the first version, we reached the point where we wanted to allow users to see the contrast for “composite” objects, those which have multiple fills with different levels transparency and different blend modes, those which also lie against other “composite” objects with multiple fills, and so on. You can see an example of a simple case on the left, and complex on the right:

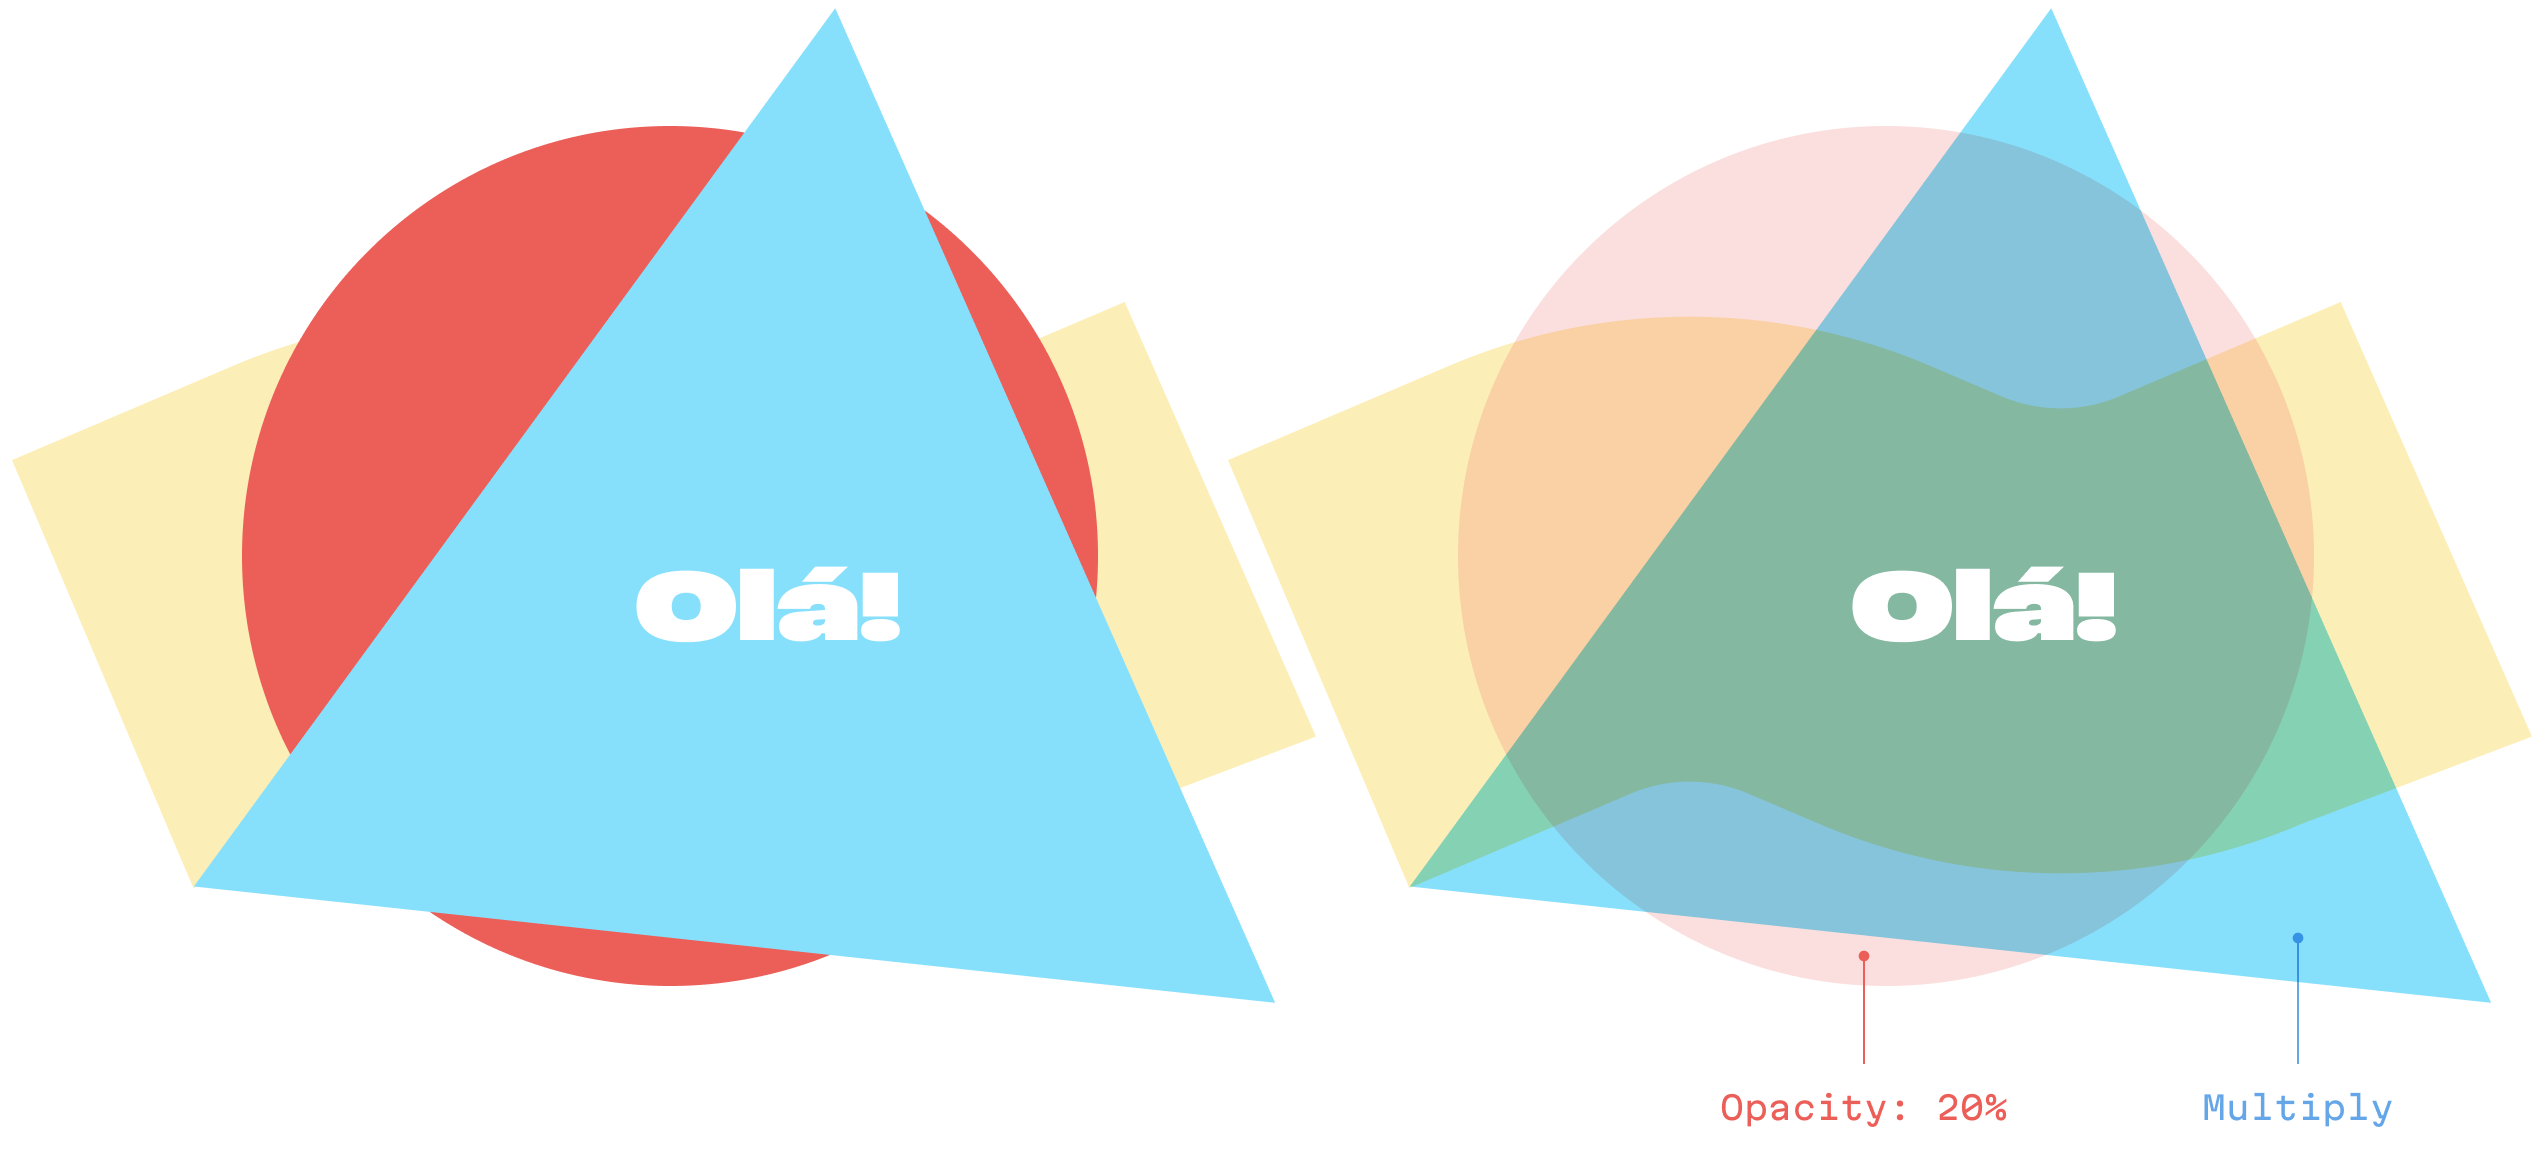
Simple vs. complex cases
And you can see an example of this complex behavior in the video:
Notice how the text also changes color because this element is partially transparent
So, in essence we somehow needed to be able to mix the fills on the object that the user has selected, and calculate the computed color from this. Additionally, we also had to—and this next part sounds unrealistic—account for the objects lying under the selected object, the fills within them, and calculate the computed color for all of them, too. (We’d then have to use those two values to get our final contrast value.)
The entire solution can be boilded down to two steps: finding all intersecting elements that comprise the background for the selected element, and second, mixing the computed colors for all elements and their fields.
When approaching a problem, it’s a good practice to try and implement the obvious, straightforward solution first. After all, there’s no need to do extra work when those efforts could be better spent elsewhere.
But, as we’ll see, when this approach does not bare fruit, often, a change of perspective is necessary.
Nonetheless, let’s start as I did.
Failed attempt one: approaching the task head on with Culori
Approaching this task in the beginning, I was like: “color blending? This is going to be so easy. We’ll just take some library, do it, and be done.” So, my first attempt was the direct iterative blending approach, using the Culori library.
Culori provides the blend function, which accepts color codes in the form of an array, and a blend mode, and then returns the final computed color:
import { blend } from 'culori';

blend(
  ['rgba(255, 0, 0, 0.5)', 'rgba(0, 255, 0, 0.5)', 'rgba(0, 0, 255, 0.5)'],
  'screen'
);

// ⇒ { mode: 'rgb', alpha: 0.875, r: 0.57…, g: 0.57…, b:0.57… }
But… it didn’t quite work as we needed. In other words, we couldn’t quite make the Figma world and the Culori world “blend” together.
Why? First, each fill and each element in Figma have its own blend mode. These modes affect the way the fills and the layers interact with each other. On the flip side, Culori’s blend only takes one blend mode as a parameter.

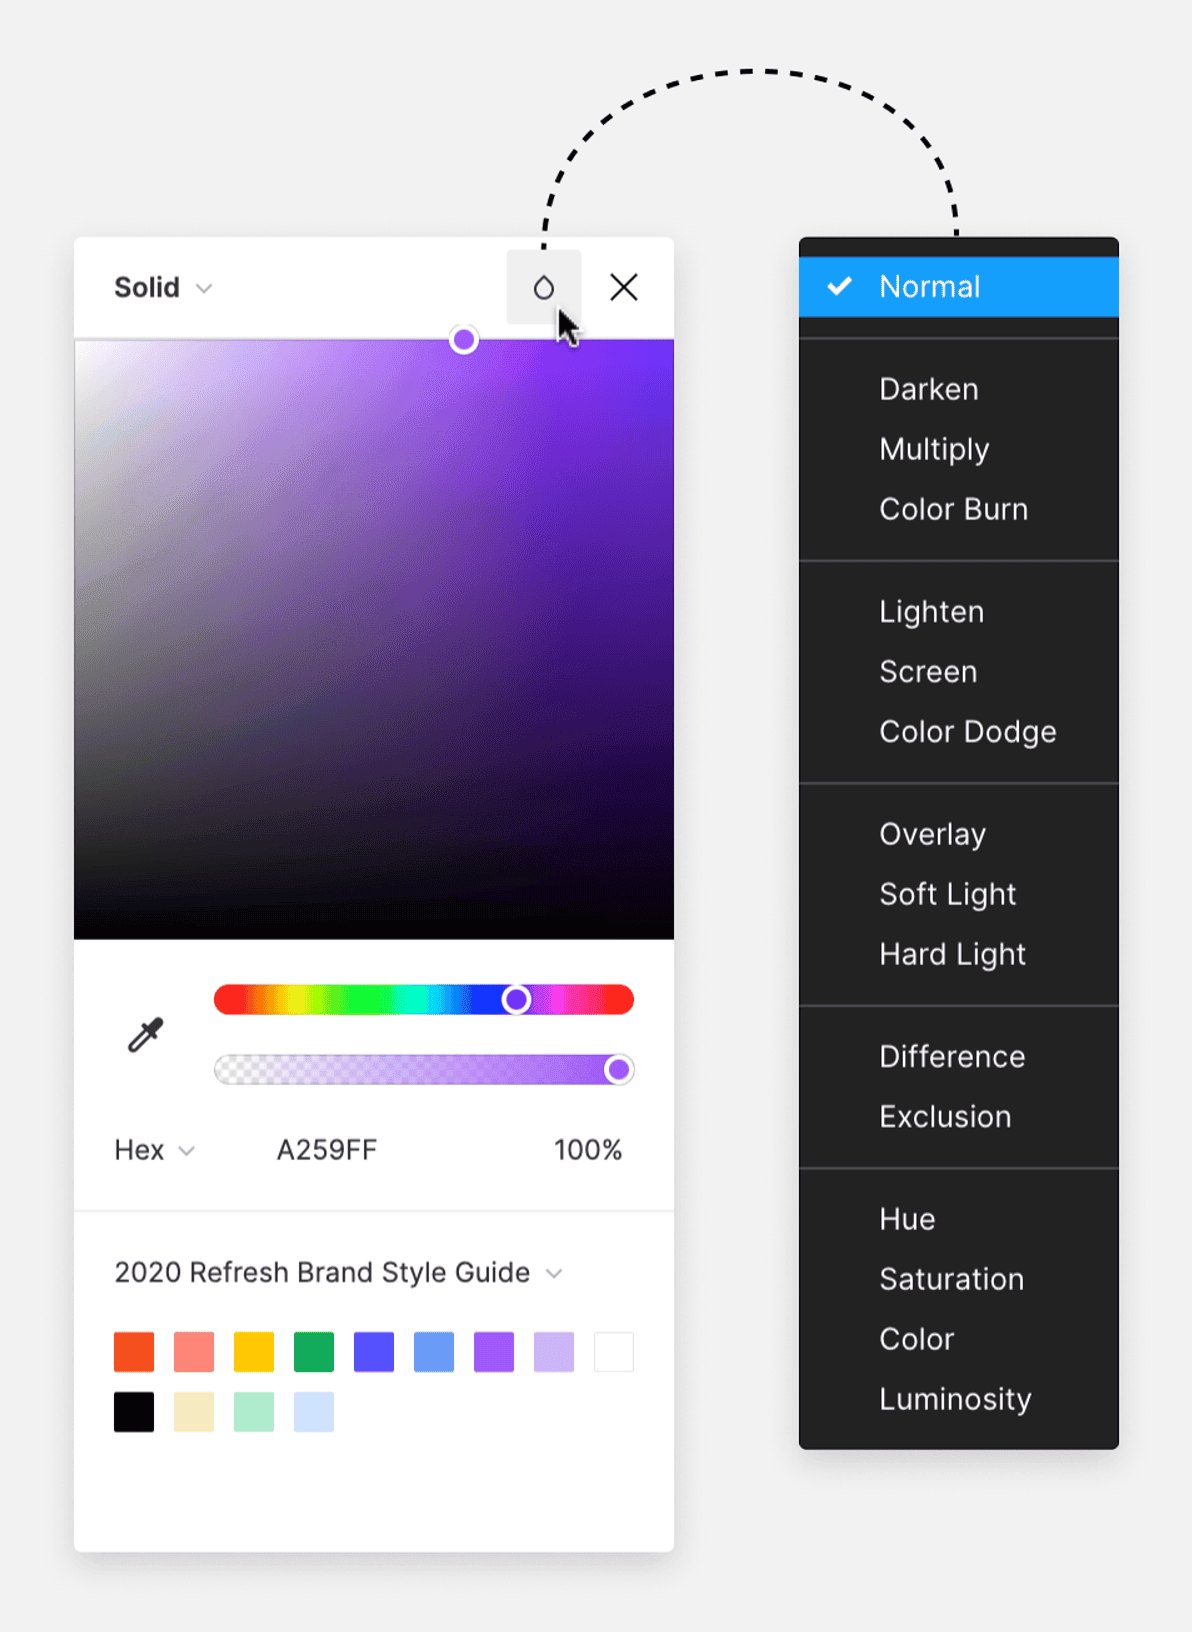
A dropdown menu shows all the blend mode options for the fill
This means that we can’t enter a bunch of fills, but instead have to calculate the computed color in a loop, step by step, like so:
- Concatenate the first two colors from the list
- Record the result
- Take the next color
- Mix it with the previous result
- Repeat the process
In code, that looks something like this:
import { blend } from 'culori';
export const blendFills = (fills: SolidPaint[]): SolidPaint => {
const [firstFill, ...fillsToBlend] = fills;
const result = fillsToBlend.reduce((acc, fill) => {
return blend([acc, fill], fill.blendMode, 'rgb');
}, firstFill);
return result;
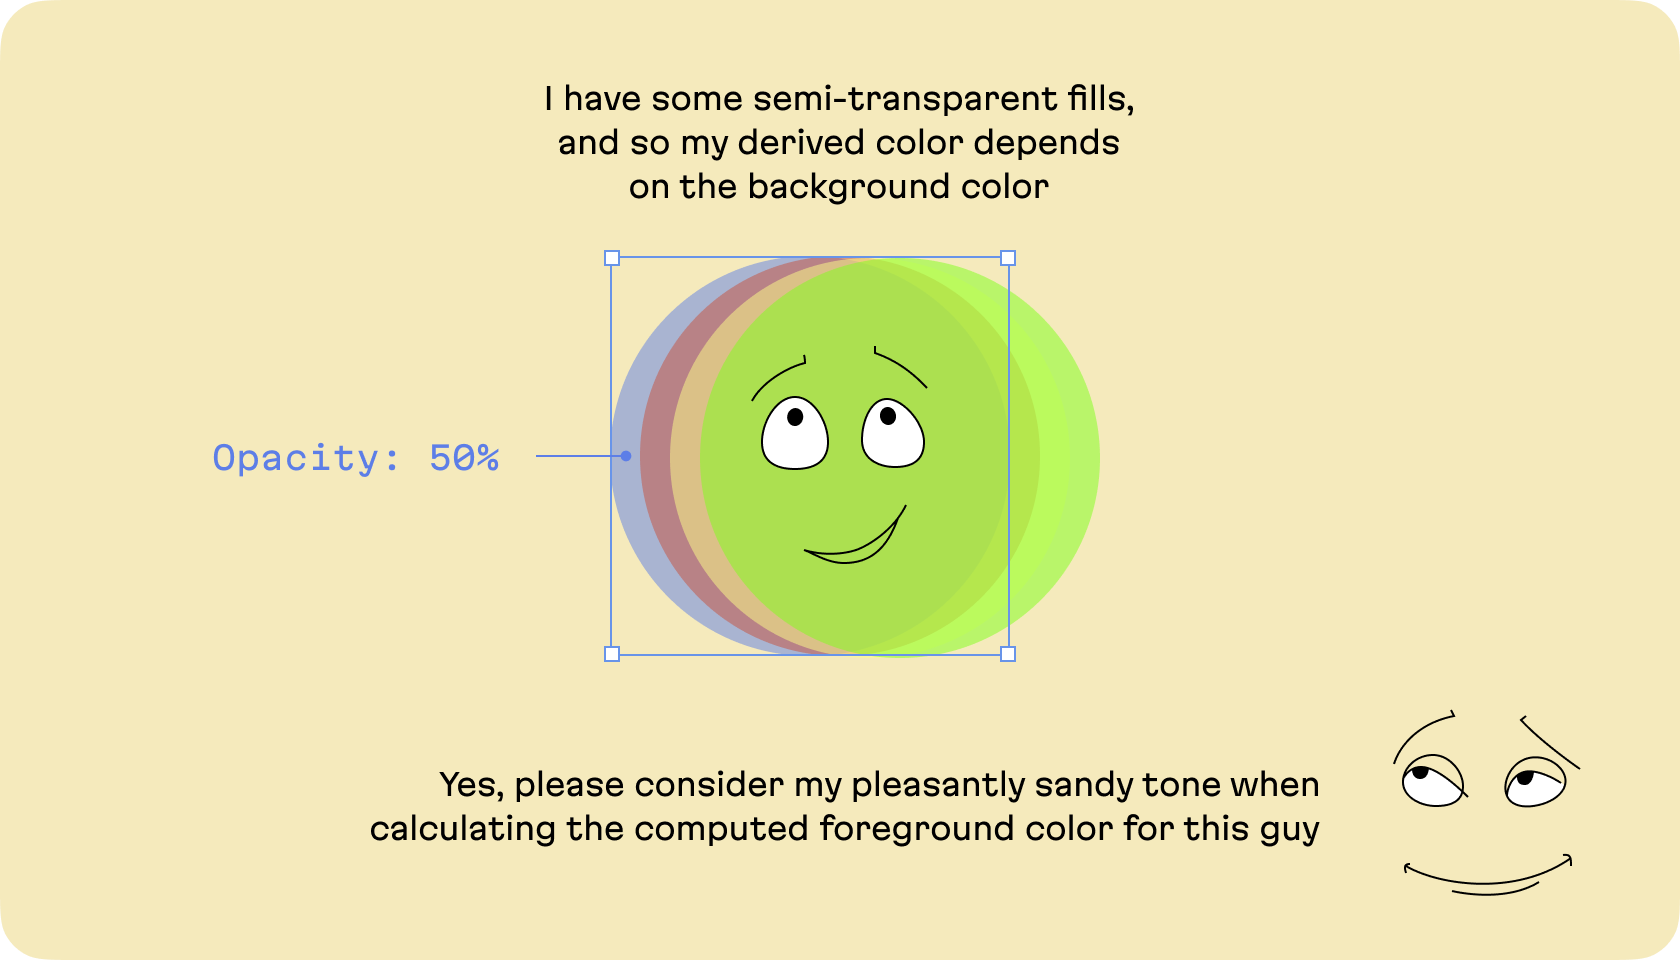
};But that’s not quite enough. In fact, we can’t just “glue” the first pair of background fills together for the selected element, because the first fill in the list, which has transparency values, also needs “to be glued” to whatever it’s on, using its own blend mode.

This means that we should take all elements below the object selected by the user, up to the page itself and process them in a certain way:
- Take all layers
- Take all their fills
- Find the deepest fill without transparency
- Start mixing shades from it, up to the selected one (because fills and layers below the one without transparency are not needed, since they aren’t actually visible)
And when doing so, we must also filter disabled fills. 😫
Failed attempt one (continued): an algorithm with Culori
Now, before you continue reading, I’m going to make a disclosure: there were a metric ton of code example showing how I screwed around with this approach, but at the end of the day, I decided that wasn’t the point of this story.
So, instead, I’ve left the final functions for review, just to note that, they didn’t work either:
export const blendLayersColors = (layers: SceneNode[]): string | undefined => {
  // skip hidden elements and elements without fills
  const visibleLayers = layers.filter((layer) => !isLayerInvisible(layer));

  const firstNonTransparentLayerIndex = visibleLayers.findIndex(
    (layer) => !ifLayerHasTransparency(layer)
  );

  // no need to take fills below the opaque element,
  // blending will start from bottom to top starting from the opaque layer
  const layersToBlend = visibleLayers.slice(
    0,
    firstNonTransparentLayerIndex + 1
  );

  // generate a list of fills from the list of layers by arranging the order correctly
  const allFills = layersToBlend.map((layer) => layer.fills.reverse()).flat();

  const visibleFills = allFills.filter(
    (fill) => fill.visible === true && fill.opacity !== 0
  );

  // same as with elements - fills below opaque are not needed
  const firstNonTransparentFillIndex = visibleFills.findIndex(
    (fill) => fill.opacity === 1
  );

  const fillsToBlend = visibleFills
    .slice(0, firstNonTransparentFillIndex + 1)
    .reverse();

  const [firstFill, ...restFills] = fillsToBlend;

  // start mixing in a loop with intermediate results at each step
  const result = restFills.reduce((acc, fill) => {
    return blend(
      [acc, { ...fill.color, alpha: fill.opacity }],
      fill.blendMode,
    );
  }, firstFill);
};
By the way, if you saw that and thought this code actually might work, you’d be right! It actually does work just fine as a solution for simple situations. But just think how many variations there are to how a user might arrange Figma elements and fills. There was always some case where this code didn’t work and had to be constantly fixed and tweaked.
For our task, this approach turned out to be very unreliable. Why? Well, because it was a naive (but necessary) approach! And most importantly, this approach is only suitable for a flat list of fills: it does not assume that elements are arranged in a tree structure.
But you know how layouts are organized in Figma, right? Everything is nested!

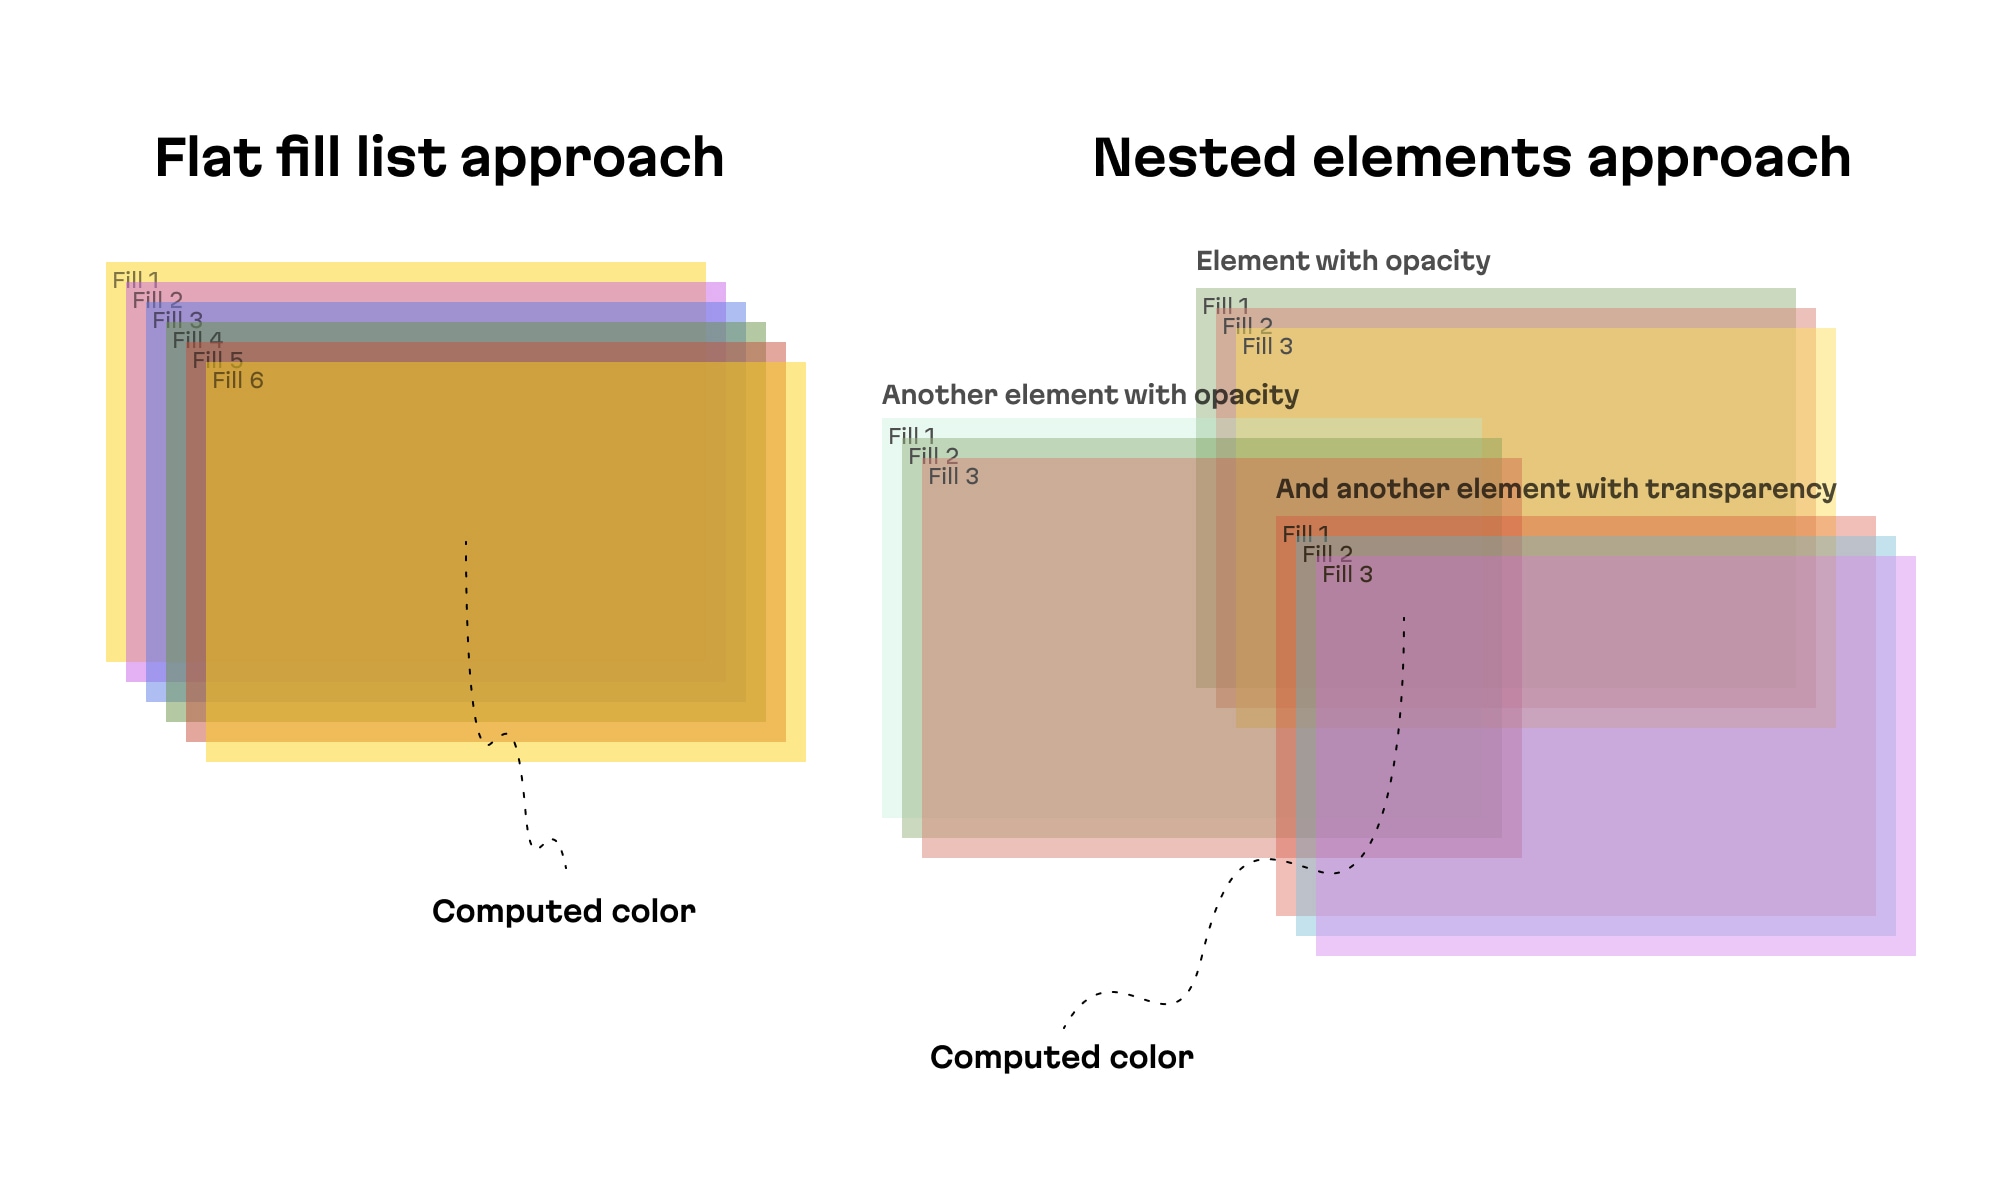
The difference between flat and nested cases
It’s time for a change of perspective
Well, what now? Before we jump to some complex solution, let’s take a moment to reflect. Here’s a question: is there a simpler way? That is, is it possible that we can avoid trying to iteratively reinvent the mixing mechanism to the smallest detail?
This is where we can again turn to the lessons of horizonatal innovation mentioned at the outset of this article. From this mindset, an idea occurs: what if we tried to mix colors in a more “declarative” way?
I mean, wouldn’t it be cool if we simply described (in code) the specific situation the user sees in front of them in terms of Figma fills and then get the resulting color?
For example, what if we had some kind of dropper mechanism–say here’s a bunch of layers and fills in them with transparency, a lot of transparencies and blend modes, and just reproduce them in the same way as they are presented in Figma and give me the resulting color.
And actually, there is such a mechanism: Canvas in the browser.
More specifically, the OffscreenCanvas is the appropriate inspiration for us, because we don’t need to display our canvas in an interface, we just need it virtually, for calculations.
The idea is simple: take the tree of elements from Figma, as created by the user, and literally transfer it to the browser Canvas as is.
But how to get the computed color? The getImageData method returns an array of pixels, and it returns the color of each pixel as an array of four numbers that represent the RGBA colors: r, g, b, a.
A little problem with the Canvas API
Canvas isn’t exactly perfect in this situation either: there are no groups here.
Since we’re talking about the Canvas API, we need to understand that it’s not vector-based, but raster-based. This means that we need to draw shapes on it, and can’t just transfer an element tree from Figma to the canvas. This is a problem, because we need to draw Figma elements as groups… and Canvas can’t do that.
Let me emphasize this critical element of our task: the tree structure of elements and the ancestor-descendant relationship is very important for a document in Figma, because the transparency and blending mode of an ancestor affects all its descendants.
With Canvas API, we can’t work with a concept like the ancestor-descendant paradigm, we can just draw shapes on it, and this means that drawing directly on the canvas is not suitable for us.
How can we simply draw a structure where there is a parent frame, other parent frames are nested within it, other parent frames have shapes nested within them, and each element in such a chain has its own transparency and blend mode?
We can’t.
The solution: SVG
But there is a solution: we can use the SVG format.
SVG understands the concept of ancestor-descendant, transparency and blending mode, too.
And the most important thing is that we can draw with SVG on the Canvas! 🎉 So, we can take the tree of elements from Figma, convert it to SVG as is from the nesting POV, save the tree-like structure, and then draw it on the canvas.
From there, we can use getImageData to get the color of the resulting image.
The composition
Since we want to use getImageData to get data from the Canvas API, we need to define the visual composition of how the shapes will be placed, so that we can then get that data.
In this case, there’s no need to implement the exact elements that the user will be working with, we just need to draw a couple of pixels that will represent the relation of the elements and its fills.
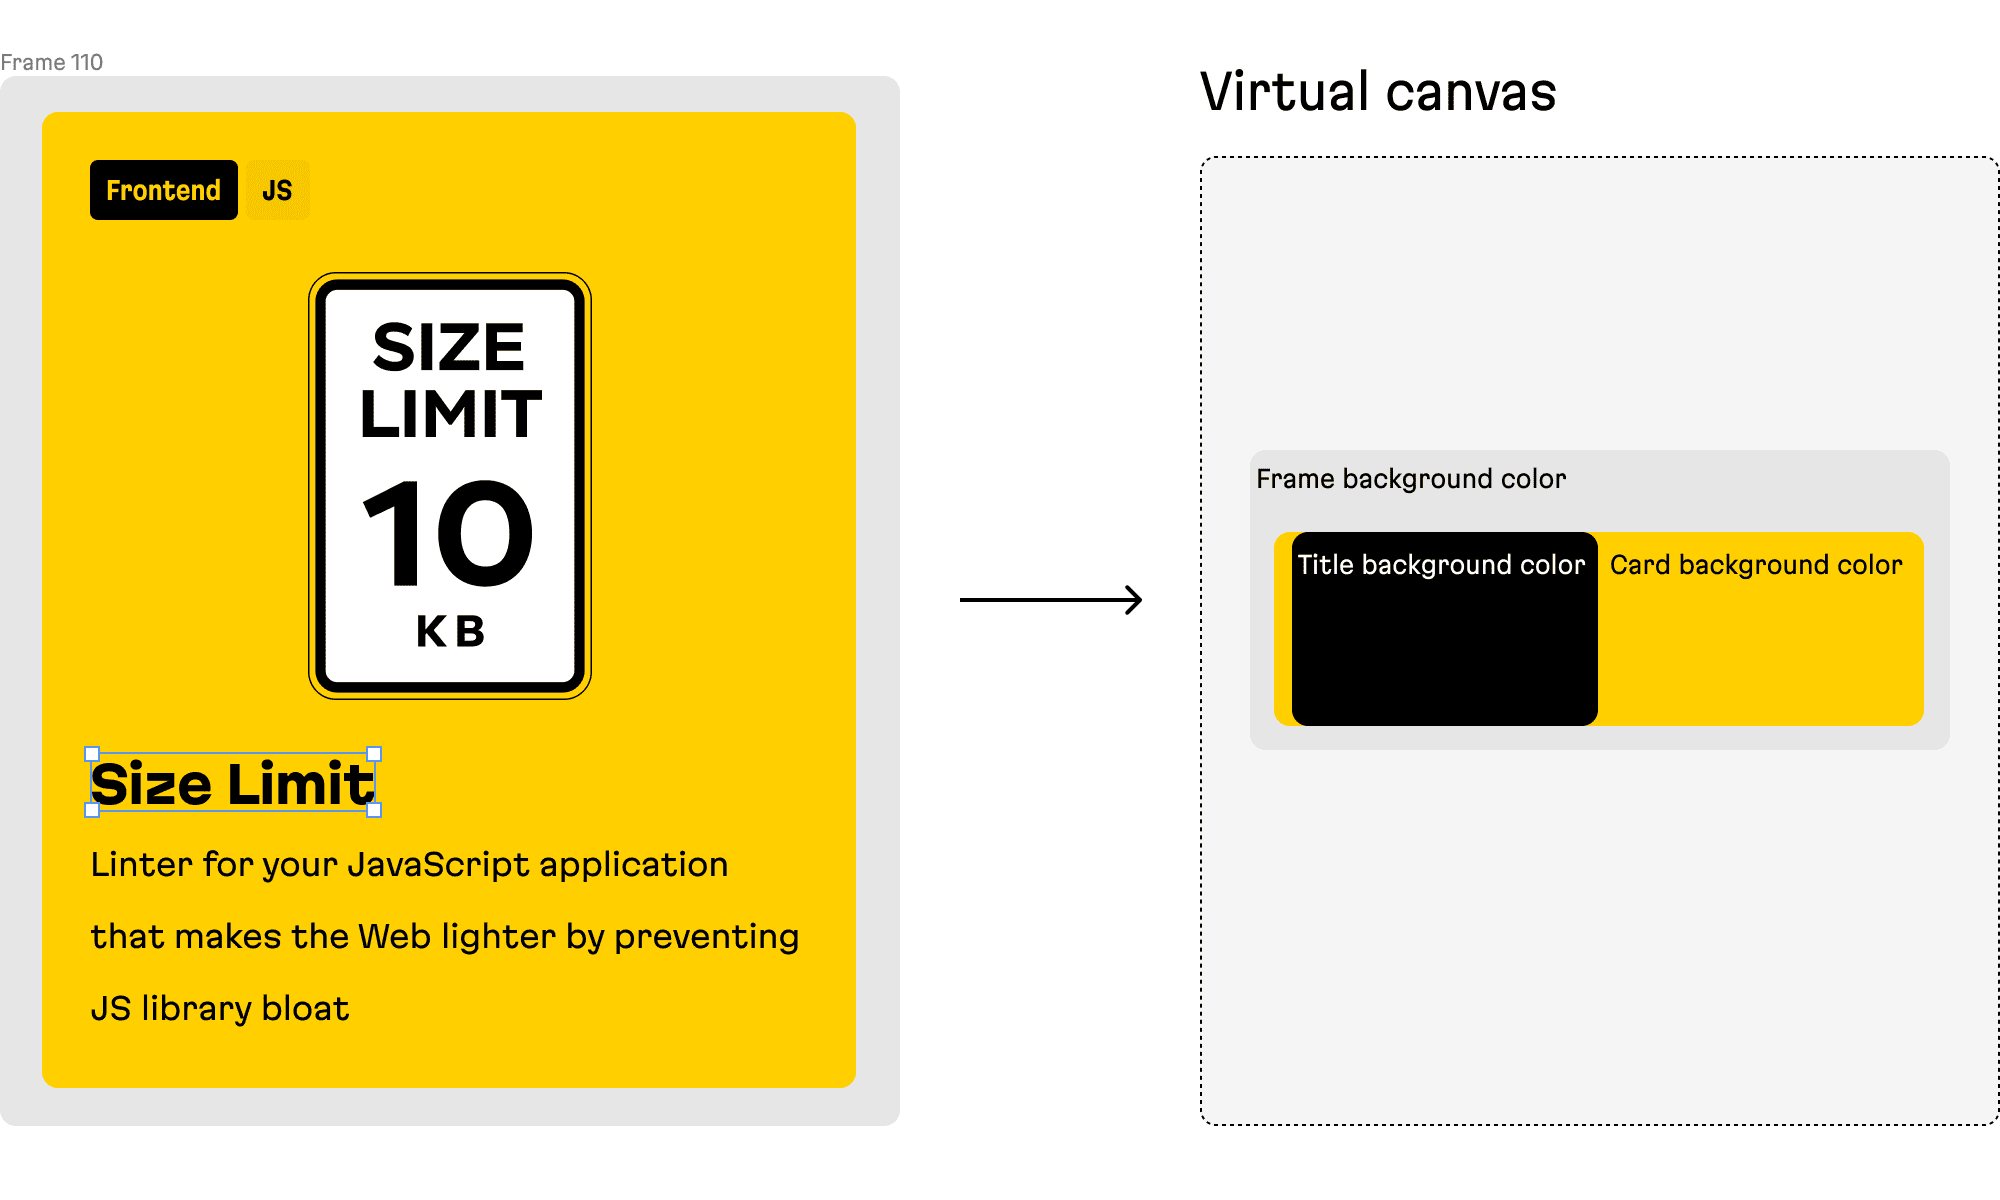
So, we’ll draw a composition of rectangles, where all the elements and fills belongs to user’s selection background will fill the whole width, and exact user selection will lay on the right side.
For example, when a user selects the title of a card to check the contrast of the title with its background, in the virtual canvas, we’ll draw something like this composition of rectangles:
The magic unfolds
It’s time to reveal our hand. First of all, let’s determine the data format we’ll be working with: this is the tree-like data structure where every node of the tree consists of several properties.
export interface PolychromNode {
  blendMode: BlendMode;
  children: PolychromNode[];
  fills: FigmaPaint[];
  opacity?: number;
  visible?: boolean;
}
We’ll use this data to draw fills and rectangles recursively later.
Now, let’s define the coordinates of some boxes on virtual canvas for background and foreground objects. We’ll also define the coordinates of the “eye droppers”, and from these points, we’ll get information about the colors:
const BACKGROUND_BOX = {
  eyeDropperX: 10,
  eyeDropperY: 10,
  height: 10,
  width: 20,
};

const FOREGROUND_BOX = {
  eyeDropperX: 0,
  eyeDropperY: 0,
  height: 10,
  width: 10,
};

Let’s not forget to take color spaces into account, as Figma recently added P3 support, and the Canvas API also offers support. We create a dictionary for matching data from the Figma to the Canvas API:
export type FigmaColorSpace = 'DISPLAY_P3' | 'LEGACY' | 'SRGB';

export const CanvasColorSpace: Record<FigmaColorSpace, 'display-p3' | 'srgb'> =
  {
    DISPLAY_P3: 'display-p3',
    LEGACY: 'srgb',
    SRGB: 'srgb',
  };
Now, we create canvas and context objects:
const canvas = new OffscreenCanvas(
  BACKGROUND_BOX.width,
  BACKGROUND_BOX.height
);

const ctx = canvas.getContext('2d', {
  colorSpace: CanvasColorSpace[figmaColorSpace]
});
And we’ll start to draw; we create an svg element, draw the composition on it, and then pass it to render with Canvas:
const drawNodesOnContext = async (
  ctx: OffscreenCanvasRenderingContext2D,
  userSelection: PolychromNode,
  colorSpace: FigmaColorSpace
): Promise<void> => {
  const svg = document.createElementNS('http://www.w3.org/2000/svg', 'svg');

  svg.setAttribute('width', `${BACKGROUND_BOX.width}`);
  svg.setAttribute('height', `${BACKGROUND_BOX.height}`);

  drawNodesOnSvg(svg, userSelection, FOREGROUND_BOX, BACKGROUND_BOX, colorSpace);

  await renderSvgOnCanvas(ctx, svg);
};
The drawNodesOnSvg function is a core part of rendering visual elements in the SVG format; it operates by iterating over the PolychromNode nodes and applying specific attributes and styles to them based on their properties:
export const drawNodesOnSvg = (
  svg: SVGSVGElement,
  pair: PolychromNode,
  foregroundBox: CanvasRect,
  backgroundBox: CanvasRect,
  colorSpace: FigmaColorSpace
): void => {
  const drawNode = (node: PolychromNode, parentGroup: SVGGElement): void => {};

  drawNode(pair, svg);
};
Here’s a breakdown on creating SVG groups: for each node, we create a group (<g> element), allowing for the organized structuring of our SVG elements:
const svgGroup = document.createElementNS(
  'http://www.w3.org/2000/svg',
  'g'
);
Now, let’s look at setting opacity and blend modes: this function sets the opacity of each group based on a node’s opacity, and it also applies a blend mode translated from the Figma format to the SVG’s style, ensuring visual consistency:
if (node.opacity !== 1) {
  svgGroup.setAttribute('opacity', `${node.opacity?.toFixed(2) ?? 1}`);
}

const mappedBlendMode = mapFigmaBlendToCanvas(node.blendMode);

svgGroup.setAttribute(
  'style',
  `mix-blend-mode: ${mappedBlendMode}; isolation: isolate;`
);
Above, by setting isolation: isolate; on an SVG group, we essentially create a boundary for blend modes.
This means that the blending effects applied to the elements within this group will only interact with each other, and not with elements outside the group. In terms of color blending: “What happens in this group, stays in this group.”
The mapFigmaBlendToCanvas function translates Figma’s blend modes to CSS blend modes, ensuring visual consistency when Figma designs are rendered on Canvas.
export const mapFigmaBlendToCanvas = (
  figmaBlend?: BlendMode
): CSSProperties['mixBlendMode'] => {
    const mapping: Record<BlendMode, CSSProperties['mixBlendMode']> = {
        COLOR: 'color',
        COLOR_BURN: 'color-burn',
        COLOR_DODGE: 'color-dodge',
        // ... rest of modes
    }
}
The next function filters out only the visible fills from each node. It then creates an SVG rectangle (<rect>) for each fill, determining if it should be placed in the foreground or background box, based on whether the node is selected:
const visibleFills = node.fills.filter(isVisibleSolidFill);

visibleFills.forEach((fill) => {
  const svgRect = drawFillAsRect(
    fill,
    node.isSelected === true ? foregroundBox : backgroundBox,
    colorSpace
  );

  if (isEmpty(svgRect)) return;

  svgGroup.appendChild(svgRect);
});
Each SVG rectangle that represents a fill is appended to the group created for the node, and in turn, each group is added to its parent group, maintaining hierarchy and structure:
parentGroup.appendChild(svgGroup);This function recursively applies this process to all child nodes of the initial node, ensuring that the entire node hierarchy is accurately rendered:
node.children.forEach((childNode) => {
  drawNode(childNode, svgGroup);
});
This way we end up with a detailed and accurate representation of the nodes (including their visual styles and hierarchical relationships) in an SVG format.
Render a single fill
The drawFillAsRect function creates an SVG rectangle (<rect>) to visually represent a Figma fill. It sets a rectangle’s size based on the provided dimensions (via rectBox), applies the appropriate blend mode (translated from Figma to CSS standards), and assigns the fill style, (taking color space considerations into account):
export const drawFillAsRect = (
  fill: FigmaPaint,
  rectBox: CanvasRect,
  colorSpace: FigmaColorSpace
): null | SVGGElement => {
  const svgRect = document.createElementNS(
    'http://www.w3.org/2000/svg',
    'rect'
  );

  svgRect.setAttribute('width', String(rectBox.width));
  svgRect.setAttribute('height', String(rectBox.height));

  if (notEmpty(fill.blendMode)) {
    const mappedBlendMode = mapFigmaBlendToCanvas(fill.blendMode);

    if (notEmpty(mappedBlendMode)) {
      svgRect.setAttribute('style', `mix-blend-mode: ${mappedBlendMode};`);
    }
  }

  const fillStyle = determineFillStyle(fill, colorSpace);

  if (isEmpty(fillStyle)) return null;

  svgRect.setAttribute('fill', fillStyle);

  if (fill.opacity !== 1) {
    svgRect.setAttribute('opacity', `${fill.opacity?.toFixed(2) ?? 1}`);
  }

  return svgRect;
};
Moving SVG to Canvas
The renderSvgOnCanvas function serves as a bridge between SVG graphics and Canvas rendering, translating SVG element details for use with Canvas. This process involves a few key steps.
First, SVG serialization. Here, the function begins by converting the SVG element into a string using the XMLSerializer interface:
const xml = new XMLSerializer().serializeToString(svg);Next up, Base64 encoding. The serialized SVG string is encoded into Base64, which represents binary data in ASCII string format. This step is crucial for converting the SVG into a format that can be used as a valid image source:
const svg64 = btoa(xml);
const b64Start = 'data:image/svg+xml;base64,';
Now we move on to__creating an image element__; an HTML <img> element is dynamically created, and this element will serve as a container for the encoded SVG, allowing it be treated as an image:
const img = document.createElement('img');It’s time to set the image source. We must how construct a data URL by combining a Base64 prefix with the encoded SVG string. This URL is then set as the src attribute of the created image element. The browser interprets this data URL as the image’s source, effectively loading the SVG as an image.
img.src = b64Start + svg64;And the final step: drawing on Canvas. Once the image has been loaded, an event (img.onload) triggers the drawing action. The loaded image (now containing the SVG graphic) is drawn onto the Canvas using the drawImage method. We render the SVG onto the Canvas, and its graphical content appears:
img.onload = () => {
    ctx.drawImage(img, 0, 0);
}
Getting data from the Canvas
The getColorData function extracts RGBA values from Uint8ClampedArray and converts them into a standardized format, checking for the presence of color values:
export interface ColorData {
  alpha: number;
  b: number;
  g: number;
  r: number;
}

export const getColorData = (fill: Uint8ClampedArray): ColorData | null => {
  const [r, g, b, alpha] = fill;

  if (isEmpty(r) || isEmpty(g) || isEmpty(b)) return null;

  return convert255ScaleRGBtoDecimal({ alpha, b, g, r });
};
The getFillFromCtx function retrieves the color data from a specific pixel on a Canvas. It uses the Canvas API context’s getImageData method to access the color information at the given coordinates (x, y), accounting for the specified color space, and returns a Uint8ClampedArray containing the RGBA values of that pixel.
export const getFillFromCtx = (
  ctx: OffscreenCanvasRenderingContext2D,
  x: number,
  y: number,
  colorSpace: FigmaColorSpace
): Uint8ClampedArray => {
  return ctx.getImageData(x, y, 1, 1, {
    colorSpace: isSupportsOKLCH ? CanvasColorSpace[colorSpace] : 'srgb',
  }).data;
};
And then that function just takes in the Canvas context, as well as the coordinates from BACKGROUND_BOX for the background, and FOREGROUND_BOX for the foreground.
const bgColorData = getColorData(
  getFillFromCtx(
    ctx,
    BACKGROUND_BOX.eyeDropperX,
    BACKGROUND_BOX.eyeDropperY,
    figmaColorSpace
  )
);

const fgColorData = getColorData(
  getFillFromCtx(
    ctx,
    FOREGROUND_BOX.eyeDropperX,
    FOREGROUND_BOX.eyeDropperY,
    figmaColorSpace
  )
);
And with this data we can simply calculate final required contrast ratio, like so:
const apcaScore = calculateApcaScore(
    fgColorData,
    bgColorData,
    figmaColorSpace
  );
And that’s that!
The show is over
By using this problem-solving approach, I was able to leverage pre-existing solutions like the Canvas API and SVG to recreate the necessary Figma functionality for the Polychrom plugin. Sure, my first approach didn’t work as intended, but that’s all part of the process. In the end, I was able to spend more time writing the actual Polychrom business logic, and less time re-inventing the wheel!

At Evil Martians, we transform growth-stage startups into unicorns, build developer tools, and create open source products. If you’re ready to engage warp drive, give us a shout!